Brazil now forecast to see double-digit inflation
Authors
Headline inflation has increased markedly across both advanced and emerging market (EM) economies this year ending up much higher than we forecast six months ago. Consumer price inflation is expected to remain elevated until at least the second quarter of 2022 as ongoing supply chain disruptions, higher energy prices, and stronger-than-expected demand in countries such as the US provide additional impetus to already buoyant goods prices. Nowhere is this clearer than in Brazil, where annual inflation rose to 10.67 per cent in October, the highest rate since January 2016. This pace of inflation has been far faster than we forecast at the start of this year and this blog outlines the reasons behind the sudden rise in Brazilian inflation this year and the prospects for next year.
While the inflationary experience in Brazil appears broadly symptomatic of the trends exhibited in other BRICS (figure 1), there is an important distinction in its most recent trajectory. Unlike India, where consumer price inflation has been consistently high since the start of the pandemic, Brazil has seen a recent surge in inflationary pressure, that is expected to peak at the beginning of next year, ensuring it overshoots the experience in other BRICS countries (figure 2).
Figure 1: Annual inflation rates in BRICS

Source: NiGEM dataset and forecast (shaded area)
Figure 2: Historical inflation (per cent) outcomes in Brazil
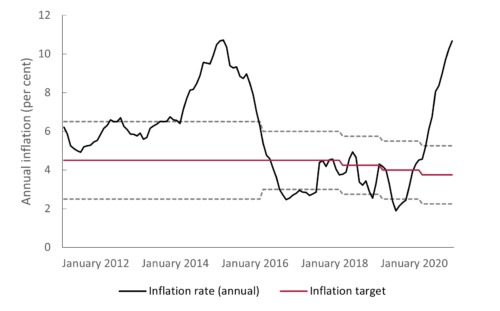
Source: Central Bank of Brazil (October 2021)
BRICS countries are also more susceptible to importing inflation, following a currency depreciation. Marodin and Portugal (2019) found that during a crisis cycle (defined as a period of high exchange rate pass-through and increased volatility of shocks to inflation), a 1% shock to the level of the exchange rate resulted in a 0.1 percentage point increase in Brazilian inflation. Figure 3 indicates that the Brazilian currency has underperformed compared to its BRICS peers since 2019, a trend that was exacerbated further with the onset of the pandemic.
One idiosyncratic shock driving inflation higher is the drought conditions affecting the southern and south-central regions of the country. Multi-decade lows in rainfall have already impacted the primary production areas of São Paulo and Mato Grosso do Sul, with international market prices of key crops already reflecting the constrained supply (figure 4). The food and drinks category accounts for a fifth (20.9 per cent) of the headline CPI number, and the ‘food at home’ subcategory increased by 13.3 per cent in the 12 months to October 2021.
Figure 3: BRICS exchange rate depreciation against US dollar
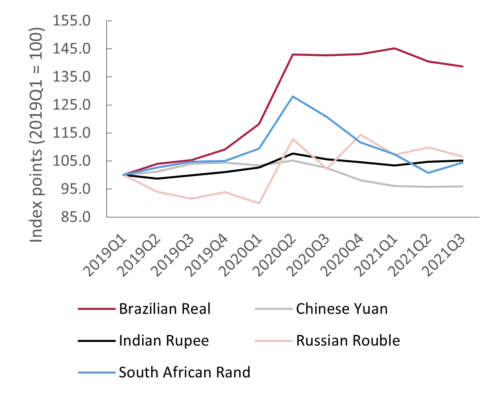
Source: NiGEM forecast
Figure 4: Evolution of commodity prices
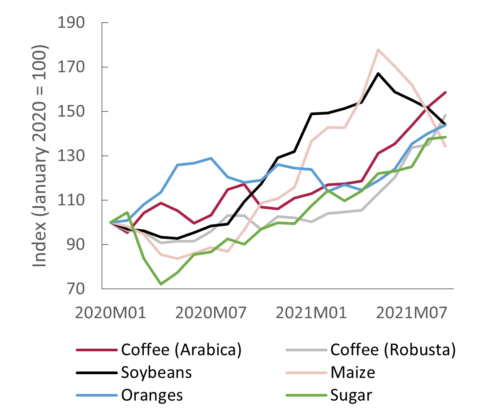
Source: World Bank Commodity Markets Outlook, NIESR calculations
Hydroelectric power accounts for 65 per cent of the electricity mix in Brazil, and the recent drought has forced a switch to more expensive thermal energy generation, pushing the marginal operating costs of Brazil’s power system to the highest level since 2015 (IHS Markit, 2021). Wholesale and retail tariffs will likely result in higher production costs for manufacturing and agribusiness companies, which could lead to second-round effects as producers pass the increases on to consumers. Electricity and household fuels accounts 11.6 per cent of the headline CPI, and these categories increased by 30.3 per cent and 31.5 per cent in the 12 months to October 2021 (IBGE, 2021). Costlier fuels likely reflect not only higher commodity prices, but the weaker exchange rate, as the Brazilian Real continues to underperform against its BRICS peers (Figure 3). More recently, Mapbiomas Brazil published survey data indicating that the country has lost 15 per cent of its surface water in the three decades to 2020, suggesting that cyclical weather patterns such as La Niña can only intensify the loss of surface water.
The political economy environment will be crucial in the development of the inflation profile: looser fiscal policy will likely add further impetus to consumer inflation, as the lower house of Congress passed a constitutional amendment that would allow President Bolsonaro to double welfare spending next year ahead of elections. Surveys on voter intentions indicates former president Lula, whose Bolsa Família welfare scheme made him the darling of the poorer electorate, remains the firm favourite for next year’s elections.
The fate of the Brazilian economy is also inextricably linked to US policy, and the end of US ultra-accommodative policy cycle could pose a risk to Brazilian inflation. Using our NiGEM model, we have previously shown that financial spillovers in case of an unanticipated tightening in the US monetary policy could impact countries with higher risk premia such as Brazil, with the effect of these negative spillovers being as much as 1 percentage points in terms of Brazil’s GDP (Holland, Küҫük, and Macchiarelli, 2021).
The Central Bank of Brazil (BCB) has moved to limit the pass-through of higher fuel and food prices to consumer prices, by raising the policy rate by 575 basis points since March to 7.75 per cent. With monetary policy operating with a lag against a background of higher-than-expected inflation so far this year, we expect headline inflation will remain high peaking in the first quarter of 2022. Although we forecast that inflation will moderate next year as the effect of the central bank’s hiking cycle pays dividends, the protracted nature of the drought could well keep inflation high during the remainder of the year before base effects see annual inflation drop in 2023. Table 1 reflects the changes NIESR has made the annual inflation forecast for Brazil. While the moderation in headline inflation after 2022 may appear overly optimistic, the impact of base-effects following the 2014 inflationary period informed our forecast for annual inflation in 2023.
Table 1: Change in Brazilian annual inflation forecast
| Average annual inflation rate (per cent) | 2021 | 2022 | 2023 |
| Autumn forecast | 8.1 | 8.3 | 2.7 |
| Spring forecast | 4.3 | 3.2 | 3.8 |
| Difference | 3.8 | 5.1 | -1.2 |
Related Blog Posts


Related Projects


Related News


Why it’s not worth worrying that the UK has technically entered a recession
26 Feb 2024
4 min read
Related Publications

Recessionary Pressures Receding in the Rearview Mirror as UK Economy Gains Momentum
12 Apr 2024
GDP Trackers
Related events

Summer 2023 Economic Forum

Spring 2023 Economic Forum

Winter 2023 Economic Forum

Autumn 2022 Economic Forum

Summer 2022 Economic Forum

Spring 2022 Economic Forum

Winter 2022 Economic Forum
