CPI Inflation, August 2021
CPI inflation rose by a large amount (1.2%) and is now at 3.2%. Part of this increase was due to the “base effect” of the 0.4% fall in inflation last year (July-August 2020) dropping out of annual inflation. The fall in July-August 2020 reflected the Eat out to Help out Scheme and the reduction in VAT for the hospitality sector. However, in addition to this was a very large element of new inflation, with prices rising by 0.7% between July and August.

Authors
CPI inflation rose by a large amount (1.2%) and is now at 3.2%. Part this increase was due to the “base effect” of the 0.4% fall in inflation last year (July-August 2020) dropping out of annual inflation. The fall in July-August 2020 reflected the Eat out to Help out Scheme and the reduction in VAT for the hospitality sector. However, in addition to this was a very large element of new inflation, with prices rising by 0.7% between July and August.
The increase in inflation was spread widely across most sectors, the only exceptions being slight falls in Communications and Health.
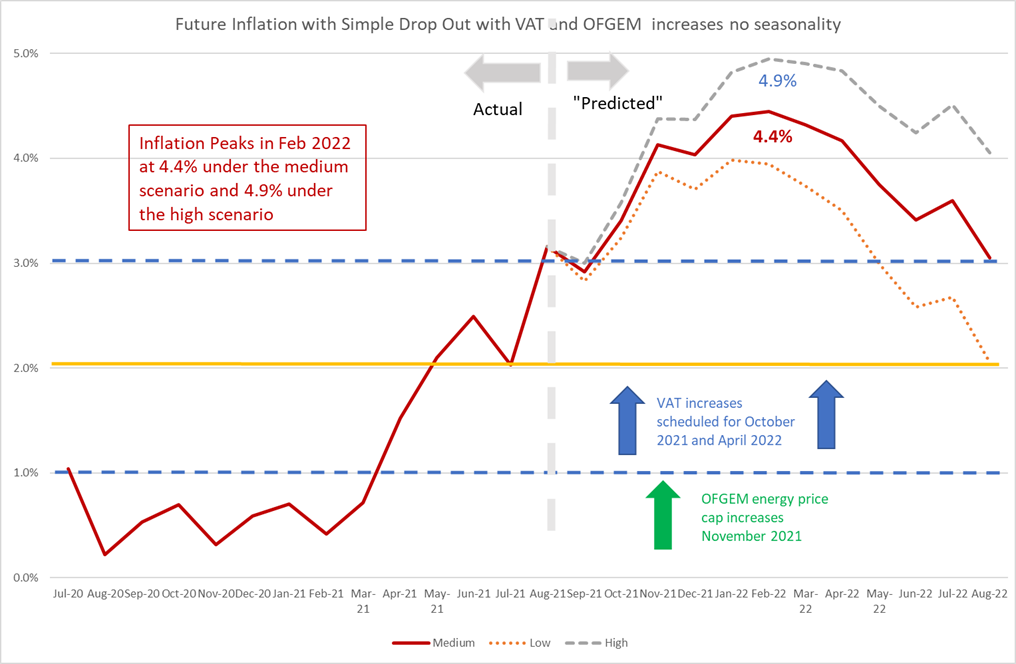
Looking forward, when we allow for the reversal of VAT reductions in the hospitality sector and scheduled rise in household energy prices announced by OFGEM, we expect inflation to increase rapidly in the later months of 2021 reaching a peak of 4.4% or higher in the first quarter of 2022, falling to about 3% by August 2022.
- The CPI inflation rate was 3.2% in August 2021, up from 2.0% in July. Part of this increase was due to 0.4% of old inflation dropping out (July-August 2020), often referred to as a “base effect”. There was additional inflation between July and August 2021 of 0.7%, which is an exceptionally high month on month figure equivalent to an annualised inflation rate of 8.7%.
- The new monthly inflation rate for July-August of 0.7% follows on after zero in June-July and three successive months of high monthly inflation at 0.5-0.6% for March-April, April-May and May-June. The average monthly inflation over the five months March to August stands at 0.48%, which is well above average would represent an annual inflation rate of almost 6% if sustained over twelve months.
- Next month the base effect will operate in the opposite direction as the increase in inflation in August-September 2020 drops-out and will contribute minus 0.4% to the September headline inflation (which will of course also include the additional new inflation for August-September 2021).
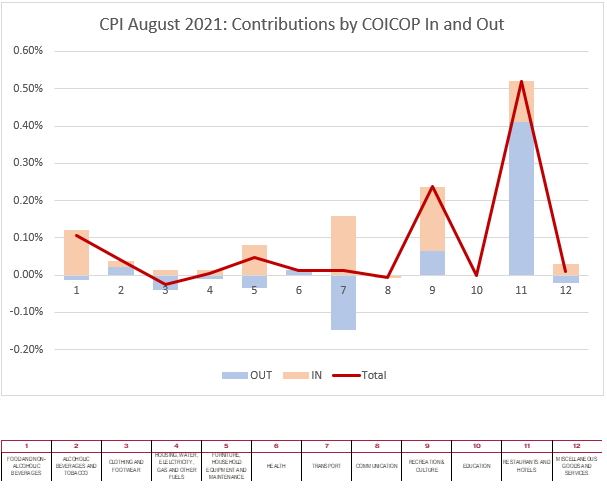
- Looking at different types of expenditure, the main contributors to the change in annual inflation in July-August were:
- Restaurants & Hotels 0.54%
- Recreation & Culture 0.24%
- Food & Non-Alcoholic Beverages 0.11%
These three expenditure types between them accounted for almost 1% of the overall increase in CPI inflation. The contribution of each type of expenditure is measured by the sum of the monthly inflation “dropping in” and “dropping out” for the type of expenditure multiplied by the weight of the expenditure type in the CPI index. The dropping in reflects the current month’s new inflation, and the dropping out the inflation from July-August 2020.
In Figure 1 we see for all twelve COICOP expenditure categories used in CPI the dropping in shaded light brown and the dropping out shaded light blue with the total given by the Mauve Line. In the case of both Restaurants & Hotels and Recreation & Culture the dropping in and out reinforced each other. In Transport, the two effects almost cancelled each other out, yielding a small effect despite quite significant new inflation. For Food & Non-Alcoholic Beverages, the contribution represented new inflation, with little effect from dropping out. In the other expenditure categories, the two effects combined led to a small and mostly positive overall effect.
Figure 1
Extreme Items
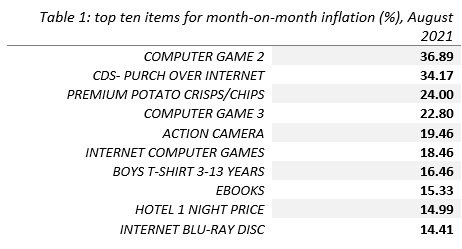
Out of over 700 types of goods and services sampled by the ONS, and there is a great diversity in how their prices behave. Each month some go up and some go down. Looking at the extremes, for this month the Top ten items with the highest monthly inflation are:
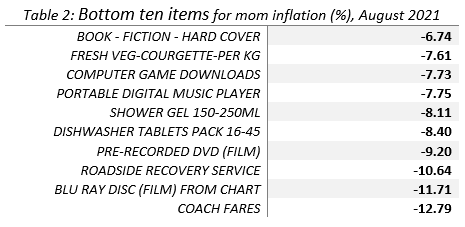
The “Bottom Ten” with the highest negative inflation in June 2021 are shown in Table 2.
It is interesting to note that in the top 10 are items belonging to the two expenditure categories Culture & Recreation and Restaurants & Hotels, which contributed most to the increase in inflation.
In both these tables we look at how much the item price-index for August 2021 has increased since July 2021, expressed as a percentage. These calculations were made by my PhD student at Cardiff, Yang Li.
Looking Ahead
We can look ahead over the next 12 months to see how inflation might evolve as the recent inflation “drops out” as we move forward month by month. Each month, the new inflation enters into the annual figure and the old inflation from the same month in the previous year “drops out”.¹
We do this under three scenarios.
- The “medium” scenario assumes that the new inflation each month is equivalent to what would give us 2% per annum – 0.17% pcm -(which is both the Bank of England’s target and the long-run average for the last 25 years)
- The “high” scenario assumes that the new inflation each month is equivalent to 3% per annum (0.25% pcm)
- The “low” scenario equivalent to 1% per annum – (0.08% pcm).
In addition, we also have additional “drop ins” resulting from government policy:
- The reversal of the July 2020 reduction of VAT to only 5% for hospitality, hotel and holiday accommodation and admission to certain attractions. This reversal will happen in two equal increases of 7.5% at the end of October 2021 and March 2022 returning VAT to the standard rate of 20%. These two increases will show up in the November 2021 and April 2022 inflation figures. Using the relevant CPI weights, if all the increase is passed on, the impact on headline inflation could be over 0.5% both times. However, 100% “pass through” is unlikely, and I have opted for 0.3% impact in each of the two months.
- OFGEM have announced the increase in the energy price-cap that will show up in the November 2021 inflation figures. Again, using the relevant CPI weights this gives a likely impact of 0.4%.
The patterns of the projections are similar, with big falls in September and December 2021 (as the big increases of 2020 drop out). There is also a big fall in April to June 2022 as the big increases of these months in 2021 drop out, with inflation dropping to 3.1% in the medium scenario by August 2022. This means that the inflation will remain well above the Bank of England’s target of 2% for some time to come (18-24 months) even if the underlying inflation remains at its historic average as in the medium scenario. Inflation will remain above 3% for at least 12 months.
Figure 2: Looking forward to August 2022
Commentary
August saw a very large element of new inflation over July of 0.7%. This is the largest month on month increase since August 2018. This new inflation was added onto the base effect of the 0.4% fall July-August 2020, giving a combined increase in annual inflation (after rounding) of 1.2%, which is the largest increase in the headline since April 1991 (when it jumped 1.6% to 8.4%). In more recent times, the only similar magnitudes were the increase of 1% in December 2009 and 0.8% in April 2021.
If we look back over 2021, there were three months of high monthly inflation between 0.5-0.6% (March-April, April-May and May-June), with a brief respite when we saw it drop to zero in June-July. The base effect of June-July 2020 dropping out lead to the big fall in headline CPI inflation of -0.5% to 2.0%, bang on the Bank of England’s target rate.
However, the surge in new inflation in August must be a concern for the Bank of England, as the inflation from July to August was again back at an extremely high level of 0.7%. The monthly inflation consistent with the Bank’s target inflation is just 0.17%, and monthly inflation in the last five months has been far higher than that. The high level of new inflation combined with the base effect led to the largest increase in headline inflation since 1991 when we were in a “high inflation” world with CPI at over 8%.² Furthermore, the jump in inflation to 3.2% takes inflation above the 3% level, which means that the Bank of England will need to explain why it has allowed inflation to exceed 3%.
The September Headline figure will perhaps be crucial. The base rate effect will be negative (-0.4%), so we should see a fall in the headline to about 3%. However, if the new monthly inflation remains at an elevated level inflation might increase which would signal that the underlying inflation in the UK economy is rising above its historic average.
In the coming months, in addition to base rate effects, there are also coming changes to government policy that will boost inflation. There is the reversal of the VAT reductions in the hospitality sector which will lead to increases in the October 2021 and April 2022 inflation figures and the increase in the household price-cap by the regulator OFGEM in November 2021.
The high levels of mom inflation in April-June 2021 will “drop out” in April-June 2022, a total negative impact on inflation of -1.6%. Thus the most likely month for a peak in inflation is February 2022, with inflation in the range 4.4-4.9%.
As we go forward, higher levels of “new” inflation may be driven by a range of factors, but the most important are:
- Adjustments and supply shortages. There have been many rapid changes and adjustments made during the pandemic, which can give rise to additional costs and disruptions to supply chains. These will continue for some months but will eventually be resolved. The shortages and disruptions to container shipments, however, are taking longer to resolve than thought.
- Labour market adjustments. Patterns of employment are changing rapidly and these take time to happen (people need to move across industries, retrain etc.). Also, Furlough has kept people out of the labour market and delayed their adjustment to new market conditions. Habits have changed and people may take time to adjust their working behaviour back to the “new normal”. Brexit continues to have its effect, particularly in those sectors relying on EU nationals who have not come back since the pandemic restrictions eased.
- Wages and salaries. These have proven hard to track during the pandemic due to composition effects (the average rose because lower paid jobs were most affected during the pandemic). The existence of labour shortages persisting may well reflect a mis-match between skills needed and current skills and worker preferences, which may lead to a general increase in wages reinforced by the rising inflation. If this happens, then we will have the positive feedback between wage and price inflation which could lead to an increase in the underlying or “trend” inflation from its historic anchor of 2%.
The first of these factors can be expected to be transitory, although it is likely to persist for longer than people anticipated a few months ago. Labour market effects may also be transitory, but may persist if there is a longer-term reduction in labour supply and participation rates resulting from changes in household preferences and the resultant decision to consume less and take more leisure (in effect, the labour supply may contract and the “natural rate” of output and employment fall). The persistence of the pandemic and Brexit effect on EU labour is harder to judge, but it shows little sign of easing this year.
The fact that inflation will probably remain well above the Bank of England’s target for the next 18-24 months might raise serious questions about continuing the Bank’s policy since 2009 of leaving interest rates fixed at near zero levels. Expectations of underlying inflation may start to rise, which would cause serious challenges for monetary policy going forward.
For further analysis of current and future prospects for inflation in the UK see:
Will Inflation take off in the UK? The Economics Observatory.
UK Economic Outlook Summer 2021: Emerging from the Shadow of Covid-19.
¹This analysis makes the approximation that the annual inflation rate equals the sum of the twelve month-on-month inflation rates. This approximation ignores “compounding” and is only valid when the inflation rates are low. At current levels of inflation, the approximation works well, being accurate to within one decimal place of percentage annual inflation.
²CPI was not calculated then, with RPI was the official inflation statistic. However, the ONS computed CPI back to 1988 retrospectively after CPI became an official statistic in 1997.
Related Blog Posts

Related Projects


Related News
Call for Papers: Lessons From Quantitative Easing & Quantitative Tightening
09 Feb 2024
1 min read
Related Publications
Inflation Differentials Among European Monetary Union Countries: An Empirical Evaluation With Structural Breaks
20 Nov 2023
National Institute Economic Review
The Macroeconomic Effects of Re-applying the EU Fiscal Rules
20 Nov 2023
National Institute Economic Review
Another Look at a Sensible Fiscal Policy for the Sharp Rise in Government Debt
20 Nov 2023
National Institute Economic Review
Monetary Policy: Prices versus Quantities
20 Nov 2023
National Institute Economic Review
Related events
Assessing Cycles and Structural Changes in Markets
Business Conditions Forum