Food and Energy Continue to Drive UK Underlying Inflation
Modest increase in inflation in September driven by food as we await the big increase in the OFGEM price cap in October
Authors
CPI rose to 10.1% in September from 9.9% in August. There was a modest drop out of 0.3% from the previous year August-September 2021, so that the increase represents the difference between the new inflation August-September 2022 of 0.5% compared to the drop out from 2021. The increase in inflation was in line with what we predicted last month.
Month on month Inflation remains well above the historic norms and the effects are very widely spread, with 11 out of 12 sectors showing positive contributions and only 1 a negative contributions. If new inflation continues at this high level, inflation will not drop significantly until 2023. The main contributors to the change in inflation in July were:
| Transport | -0.20% |
| Food and non-alcoholic beverages | 0.16% |
| Restaurants and hotels | 0.10% |
The big effect of transport was due largely to the continuing fall in fuel prices, in particular petrol and diesel. The fact that the new inflation for the month of August-September was positive across all sectors except for Transport indicates that inflation is becoming widespread.
Month on month inflation was high for September to December last year. So, as we move forward for the rest of 2022, to sustain or increase the headline inflation level, new inflation will need to come forward to replace what drops out from 2021. If the new inflation in 2022 is higher than the old inflation dropping out from 2021, we will see an increase in inflation; if the new inflation is lower we will see a decrease. The inflationary story for the remainder of 2022 will be a tug of war between past inflation pulling down with the new inflation pulling up.
The most important recent development is the announcement of the new Energy Price Guarantee (EPG) announced by the new Government on 8 September. The price of Electricity and Gas was to be fixed from October 2022 for two years, though this has since been reduced to six months initially, with the scheme being reviewed at that point. There will be an increase of 27% in the OFGEM price cap on October 1st, from its current level. This is large, but much smaller than the 80% previously announced by OFGEM. The EPG will also prevent the subsequent OFGEM price cap increases previously anticipated for January and, depending on the results of the review, April 2023. This has a very significant effect on the future path of inflation, reducing it by 3-4% over 2023. This is not the place to discuss the EPG in detail, but it is not targeted at poorer households but applies to all energy consumers. The previously announced £400 discount still applies but does not alter CPI inflation since it is in effect a transfer payment not a reduction in the unit price.
The future path of inflation will also depend on how the Russo-Ukrainian war affects the world economy and more importantly the impact of sanctions imposed on Russia by the Western powers. The G7 and EU are planning to impose a price-cap on Russian oil. The idea is that when the price-cap is operating, European and other countries can insure and transport Russian oil and avoid a reduction in the world oil supply. However, it is yet to be seen if non-Western economies such as India and China will be willing to go along with the policy. The US Treasury has announced a start date of December 5th for the price-cap on Russian oil, but as yet no details have been announced. The general principle is that the greater the effect of sanctions on world supplies, the greater the effect on prices and hence inflation. The price-cap is seen as a way of avoiding a reduction in world supply, but the recent significant reduction in oil supply announced by OPEC Plus and the Russian announcement that it will not supply oil to countries operating the price cap indicate that a reduction in world supply may be hard to avoid.
The supply of natural gas is highly inelastic in the short run as is the demand. Reductions in Russian supply, particularly since the recent explosions have stopped the flow of gas through Nord Stream 1 and 2, have led to a dramatic rise in price and an increase in expenditure and hence the revenue of gas suppliers – including Russia. In this context, whilst the EPG will reduce CPI inflation in the UK, it will not increase the supply of natural gas or the real price (net of the subsidy) paid to gas suppliers. This will mean that the EPG makes energy shortages and power cuts more likely as the subsidy will mean that demand will remain high and with the same supply this may imply rationing by power cuts. Rationing energy by power cuts rather than price increases may be a good thing. The energy is rationed more equitably with power cuts than it is by higher prices: the rich do not need to cut energy even when prices are high, but will be forced to if power cuts occur. In the longer run (3-5 years) it will be possible to replace most Russian gas in Europe, for example with a new pipeline for Israeli gas and with more expensive LNG from a variety of sources including the US. In the shorter run, some European governments, including Germany, are reversing the phasing out of coal-fired and nuclear power stations to try to fill the gap.
China’s zero Covid policy has had a major impact on the Chinese economy and global supply chains in 2022. The Chinese government has started to gradually ease the zero covid policy, under the new policy dubbed “dynamic” zero covid. This is a positive development, although it remains to be seen how rapidly it leads to a freeing up of world supply chains originating in or passing through China. No major shift is likely before the end of the 20th party congress which started in October and which is expected to confirm Xi Jinping to remain in office.
More widely, a slowdown in growth in the World as the cost-of-living crisis affects real incomes and leads to a reduction in discretionary consumer expenditure may lead to a decline in some commodity and energy prices across the world. This may mitigate the inflationary pressures somewhat, and we are already seeing this in the effect on petrol prices.
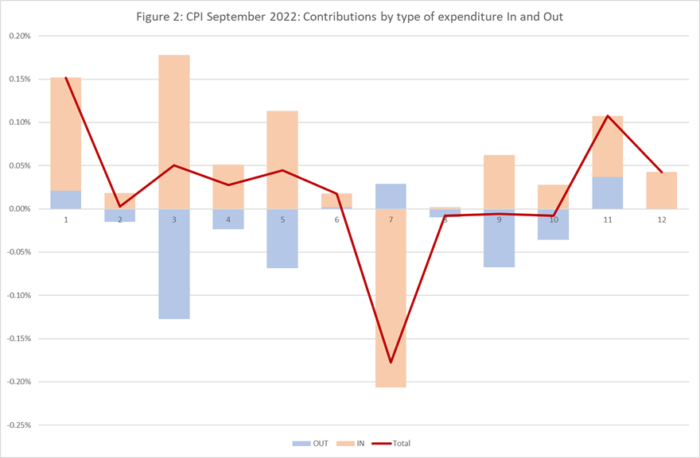
Turning back to the September inflation figures, we can look in more detail at the contributions of the different sectors to overall inflation in Figure 2, with the old inflation dropping out of the annual figure (July-August 2021) shown in blue and the new monthly inflation dropping in (July-August 2022) shown in brown, using the expenditure weights to calculate CPI. The overall effect is the sum of the two and is shown as the burgundy line.
Overall, in the tug of war between the Blue and the Brown teams, the Blue teams drop outs were significant in only 5 sectors, whilst the Brown team showed big contributions in all sectors except for Transport. In September, the Brown team won as the drop ins outweighed the drop outs, resulting in the slight increase in inflation.
![]()
Extreme items
Out of over 700 types of goods and services sampled by the ONS, there is a great diversity in how their prices behave. Each month some go up, and some go down. Looking at the extremes, for this month, the top ten items with the highest monthly inflation are:
| Table 1: Top ten items for month-on-month inflation (%), September 2022 | |
| Men’s Branded Sport Sweatshirt | 91.27 |
| Airport Parking | 65.27 |
| Coach Fares | 55.84 |
| Gas | 54.17 |
| Melon Each Eg Honeydew | 53.18 |
| Kerosene – 1000l Delivered | 43.99 |
| Computer Game 3 | 41.02 |
| Mascara | 40.64 |
| Flour-Self-Raising-1.5kg | 39.96 |
| Househld Services Maint Policy | 34.73 |
Another tough month for melon eating people with mascara in sportswear. The ten items with the highest negative inflation this month are shown in Table 2:
| Table 2: Bottom ten items for mom inflation (%), September 2022 | |
| 3-Year-Old Second-Hand Car | -17.98 |
| 2-Year-Old Second-Hand Car | -18.40 |
| Television 40″ Or Larger | -18.45 |
| Canned Tomatoes 390-400g | -18.48 |
| Smart Speaker | -19.87 |
| Personal Computers (Cpi) | -20.29 |
| Pre-Recorded DVD (Non-Film) | -22.20 |
| Sea Fares | -27.20 |
| MDF | -27.88 |
| Charcoal BBQ Not Disposable | -29.28 |
A good month to stock up with BBQs as a precaution against future power cuts.
In both these tables we look at how much the item price-index for this month has increased since the previous month, expressed as a percentage. These calculations were made by my PhD student at Cardiff University, Yang Li.
Looking ahead: Ukraine and beyond
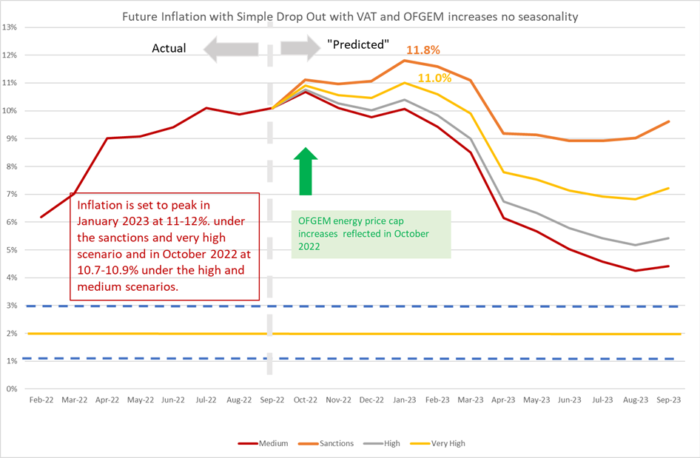
We can look ahead over the next 12 months to see how inflation might evolve as the recent inflation “drops out” as we move forward month by month. Each month, the new inflation enters the annual figure and the old inflation from the same month in the previous year “drops out”.[1] However, the invasion of the Ukraine by Russia and the western sanctions in response continue to make things uncertain. That said, the invasion and sanctions are certainly going to continue to sustain inflation as we go forward. We have therefore adjusted our four scenarios:
- The “medium” scenario assumes that the new inflation each month is equivalent to what would give us 2% per annum – 0.17% per calendar month (pcm) – which is both the Bank of England’s target and the long-run average for the last 25 years. This is a reference point only, as inflation will be well above this level for the next year or two.
- The “high” scenario assumes that the new inflation each month is equivalent to 3% per annum (0.25% pcm).
- The “very high” scenario assumes that the new inflation each month is equivalent to 5% per annum (0.4% pcm). This reflects the inflationary experience of the UK in 1988-1992 (when mean inflation was 0.45%). It also reflects the continuation of the UK average in the second half of 2021. This level of month-on-month inflation would indicate a significant break from the historic behaviour of inflation from 1993-2020.
- “Sanctions” scenario. This assumes that new inflation per month is 0.8%, equivalent to 10% per annum. This is a high figure, which is unlikely to be sustained for a prolonged period unless geopolitical conditions deteriorate or a wage-price spiral takes hold in the UK labour market.
We have added the “Sanctions” scenario since March 2022 to reflect what we can expect as sanctions and the war itself affect global energy and commodity prices. We have dropped the “low” scenario from previous releases as this is now irrelevant. The “Very high” scenario is probably the central forecast, but of course there is very high uncertainty now. Month on month inflation has averaged over 1% since February 2022.
In addition, we also have the single drop-in from the OFGEM price cap in October 2022 as opposed to the sequence of price increases anticipated prior to the EPG policy being announced.[2]
In all scenarios, there is a rapid fall in inflation from February 2023, which is due to the drop out of the high inflation figures in the corresponding months this year. However, inflation will remain well above 3% for the whole of 2023 and will not return to target until mid-2024. This forecast assumes that geopolitical tensions do not deteriorate. An escalation of the war in Ukraine and direct involvement of NATO (for example conflict of Russia directly with Poland or the Baltic states) would rapidly deteriorate the picture for inflation. Looking east, if the rising tensions between the US and China lead to an intensification of the trade war or even open military conflict in the South China sea or Taiwan (Republic of China), world supply chains would be disrupted, and inflation significantly raised.
Figure 3: Looking forward to September 2023
For further analysis of current and future prospects for inflation in the UK see:
NIESR Blog: Is the government’s energy price plan fit for purpose?
How does Inflation affect the economy when interest rates are near zero? Economics Observatory.
NIESR Economic Outlook Summer 2022
[1] This analysis makes the approximation that the annual inflation rate equals the sum of the twelve month-on-month inflation rates. This approximation ignores “compounding” and is only valid when the inflation rates are low. In future releases I will add on the compounding effect to be more precise at the current high levels of inflation.
[2] We are assuming that there is no change in the unit price of gas and electricity in April or July, though this assumption may get revised depending on the result of the review of the Energy Price Guarantee scheme.
Related Blog Posts


Related Projects


Related News


Why it’s not worth worrying that the UK has technically entered a recession
26 Feb 2024
4 min read

1.2 million UK Households Insolvent This Year as a Direct Result of Higher Mortgage Repayments
22 Jun 2023
2 min read
Related Publications

Recessionary Pressures Receding in the Rearview Mirror as UK Economy Gains Momentum
12 Apr 2024
GDP Trackers
Related events

Summer 2023 Economic Forum

Spring 2023 Economic Forum

Winter 2023 Economic Forum

Autumn 2022 Economic Forum

Summer 2022 Economic Forum

Spring 2022 Economic Forum

Winter 2022 Economic Forum
