Food Fuelling Inflation More Than Energy Prices
Authors
CPI rose to 10.1% in July, up from 9.4% in June. A big increase had been expected, because there is almost no drop out from July 2021, so all the new inflation in June-July 2022 fed directly into an increase of 0.7% in the headline CPI. Month on month Inflation remains well above the historic norms and we are continuing to see the impact of war and sanctions on Food and Energy-consuming Transport. If new inflation continues at this high level, inflation will not drop significantly until 2023. The main positive contributors to the change in inflation in July were:
- Food and Non-Alcoholic Beverages 32%
- Recreation and culture 10%
In other sectors there was a mixed story, with some small negative contributions (Furniture & Household equipment and Health) and the rest being small and slightly positive. Food remains the main driver of inflation, with Transport and Energy being less important this month.
July 2022 is an exceptional month in that all the new inflation fed through into the headline figure. Month on month inflation was high for all months in 2021 except for July; as we move forward from July 2022, to sustain or increase the headline inflation level, new inflation will need to come forward to replace what drops out from 2021. If the new inflation in 2022 is higher than the old inflation dropping out from 2021, we will see an increase in inflation; if the new inflation is lower we will see a decrease. The inflationary story for the remainder of 2022 will be a tug of war between past inflation pulling down with the new inflation pulling up.
The future path of inflation depends crucially on how the Russo-Ukrainian war affects the world economy and more importantly the impact of sanctions imposed on Russia by the Western powers. On the positive side, in July an agreement was reached between Ukraine and Russia, brokered by the UN and Turkey, to allow shipments of Ukrainian wheat via Turkey to the rest of the world. At the same time, the EU made clear that Russian exports of grains and fertilizer by ship were not subject to EU sanctions. Whilst this will serve to ease the world supplies of grain and fertilizer, there are counteracting effects of climatic events which are working to restrict food supply – these include a drought in much of northern Europe including France, Germany and the UK. The EU and Britain have yet to impose the ban on insurance for Russian oil shipments to other countries (although both have sanctioned their own purchases of Russian oil). The delay may be linked to the possible future imposition of a price-cap on Russian oil exports. However, U.S. Senators Marco Rubio, Rick Scott and Kevin Cramer have introduced legislation “to impose mandatory sanctions on any entity which registers, provides insurance to, or facilitates registration of any vessel engaged in the shipment of Russian oil, petroleum products, or natural gas to the Peoples Republic of China” which if passed would represent secondary sanctions on China (although not on other countries as yet).
There are thus mixed signals in how sanctions will play out in future months and the ensuing effect on inflation. The greater the effect of sanctions on world supplies, the greater the effect on prices and hence inflation.
For Britain and the EU, the future path of gas prices is one of the main drivers of future CPI inflation. The supply of natural gas is highly inelastic in the short run as is the demand. Reductions in Russian supply have led to a dramatic rise in price and an increase in expenditure and hence the revenue of gas suppliers – including Russia. British and Continental households are thus paying more in total for less gas and will continue to do so for some time. The Bank of England predicts that the average British household will see its expenditure on energy increase to over £4000 by January 2023 (as compared to an average of £1250 in 2021). In the longer run (3-5 years) it will be possible to replace most Russian gas, for example with a new pipeline for Israeli gas and with more expensive LNG from a variety of sources. In the shorter run, some European governments, including Germany, are reversing the phasing out of coal-fired and nuclear power stations to try to fill the gap.
China’s zero covid policy has had a major impact on the Chinese economy and global supply chains in 2022. The Chinese government has started to gradually ease the zero covid policy, under the new policy dubbed “dynamic” zero covid. This is a positive development, although it remains to be seen how rapidly it leads to a freeing up of world supply chains originating in or passing through China. No major shift is likely before the start of the 20th party congress in October.
More widely, a slowdown in growth in the World as the cost-of-living crisis affects real incomes and leads to a reduction in discretionary consumer expenditure may lead to a decline in some commodity and energy prices across the world. This may mitigate the inflationary pressures somewhat, although in the UK and EU the effect of war and sanctions is likely to dominate.
Turning back to the July inflation figures, we can look in more detail at the contributions of the different sectors to overall inflation, we can look at the old inflation dropping out of the annual figure (June-July 2021) and the new monthly inflation dropping in (June-July 2022) and use the expenditure weights to calculate CPI. In the chart below, we show the “dropping out” in blue and the “dropping in” in light brown. The overall effect is the sum of the two and is shown as the burgundy line.
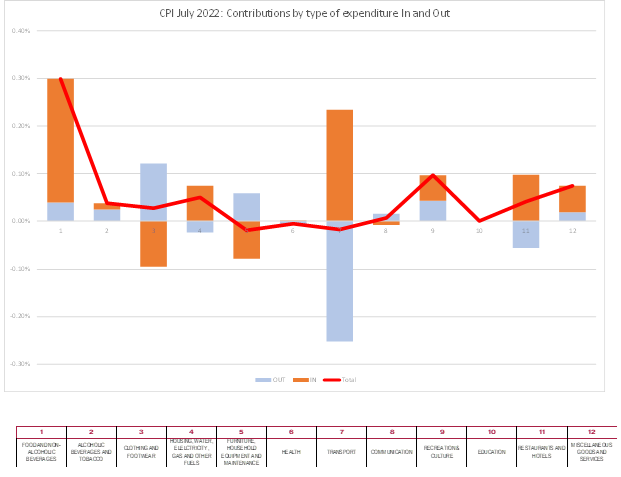
An alternative perspective is to look at the annual inflation rate across all the 12 types of expenditure. This is shown in the following chart with the red line being the overall level of CPI inflation. As we can see, the annual inflation rate is higher than CPI inflation in some sectors and lower in others. The top three inflation levels are Housing, Water & Energy, Transport, and Food and Non-Alcoholic Beverages. The bottom three are Health, Communication and Miscellaneous Gods and Services.

Extreme Items
Out of over 700 types of goods and services sampled by the ONS, there is a great diversity in how their prices behave. Each month some go up, and some go down. Looking at the extremes, for this month, the top ten items with the highest monthly inflation are:
| Table 1: Top ten items for month-on-month inflation (%), July 2022 | |
| Men’s Branded Sport Sweatshirt | 70.80 |
| Airport Parking | 67.66 |
| Gas | 54.17 |
| Kerosene – 1000l Delivered | 46.72 |
| Womens Short Sleeve Sports Top | 40.91 |
| Coach Fares | 37.30 |
| Househld Services Maint Policy | 37.17 |
| Flour-Self-Raising-1.5kg | 36.32 |
| Mascara | 35.85 |
| Boys T-Shirt 3-13 Years | 31.18 |
Another month in which Mascara wearing people in sportswear particularly hard hit. The ten items with the highest negative inflation this month are shown in Table 2.
| Table 2: Bottom ten items for mom inflation (%), July 2022 | |
| Mens Shoe Formal Style | -15.64 |
| Book-Non-Fiction-Hard-Cover | -17.54 |
| Personal Computers (Cpi) | -17.58 |
| Canned Tomatoes 390-400g | -18.27 |
| Women’s Casual Outer Jacket | -19.92 |
| Television 39″ Or Smaller | -20.53 |
| Ebooks | -24.85 |
| Charcoal Bbq Not Disposable | -25.54 |
| Blu Ray Disc (Film) From Chart | -26.18 |
| Smart Speaker | -36.25 |
A good month for older consumers who still buy hard back books and Blu Ray discs.
In both these tables we look at how much the item price-index for this month has increased since the previous month, expressed as a percentage. These calculations were made by my PhD student at Cardiff University, Yang Li.
Looking Ahead: Ukraine and Beyond
We can look ahead over the next 12 months to see how inflation might evolve as the recent inflation “drops out” as we move forward month by month. Each month, the new inflation enters the annual figure and the old inflation from the same month in the previous year “drops out”.[1] However, the invasion of the Ukraine by Russia in February and the western sanctions in response make things even more uncertain. That said, the invasion and sanctions are certainly going to continue to increase inflation as we go forward. We have therefore adjusted our four scenarios:
- The “medium” scenario assumes that the new inflation each month is equivalent to what would give us 2% per annum – 0.17% per calendar month (pcm) – which is both the Bank of England’s target and the long-run average for the last 25 years. This is a reference point only, as inflation will be well above this level for the next year or two.
- The “high” scenario assumes that the new inflation each month is equivalent to 3% per annum (0.25% pcm).
- The “very high” scenario assumes that the new inflation each month is equivalent to 5% per annum (0.4% pcm). This reflects the inflationary experience of the UK in 1988-1992 (when mean inflation was 0.45%). It also reflects the continuation of the UK average in the second half of 2021. This level of month-on-month inflation would indicate a significant break from the historic behaviour of inflation from 1993-2020.
- “Sanctions” scenario. This assumes that new inflation per month is 0.8%, equivalent to 10% per annum. This is a high figure, which is unlikely to be sustained for a prolonged period unless geopolitical conditions deteriorate.
We have added the “Sanctions” scenario since March 2022 to reflect a lower bound on what we can expect as sanctions and the war itself affect global energy and commodity prices. We have dropped the “low” scenario from previous releases as this is now irrelevant. The “Very high” scenario is probably the central forecast, but of course there is very high uncertainty now. Month on month inflation has averaged over 1% since February 2022.
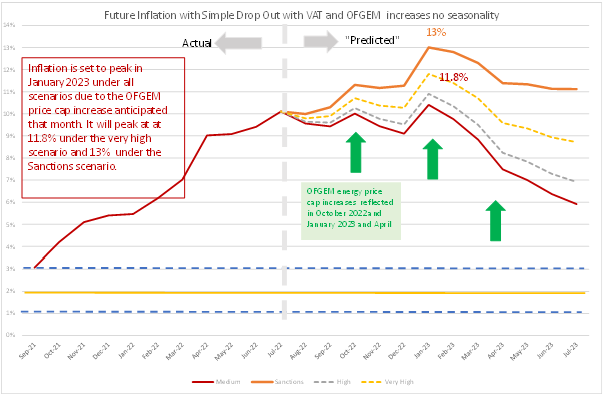
In addition, we also have additional “drop ins” resulting from how energy prices are regulated: the OFGEM price cap which alters domestic energy prices every 3 months (previously 6 months) to reflect the behaviour of wholesale energy prices over the previous months. OFGEM will increase the price-cap at the beginning of October 2022 and again at the start of January and April 2023. With the recent behaviour of energy prices this seems likely to be a big increase which will show up in the October 2022 inflation figures. We have set this at 1.5%, with the increases in January and April at 1% each. The April 2023 rise will be offset by the corresponding drop-out of the increase in April 2022. However, the increase in January will not be offset in this way, since there was no price cap change in January 2021 (OFGEM has recently increased the frequency of price cap adjustment). The effect of the price-cap increase in January 2022 is thus expected to be particularly large in terms of its input into the increase in CPI inflation.
The increase in the expected OFGEM price-cap changes has raised the expected path of inflation. The peak for the Very High scenario is now at 11.8% in January 2023. Under the sanctions scenario the peak in January 2023 has increased to 13%. The Sanctions scenario seems to be in line with the Bank of England’s August Monetary Policy Report forecast which also predicts a peak of inflation at 13% in January 2022.
In all scenarios, there is a rapid fall in inflation from February 2023, which is due to the drop out of the high inflation figures in the corresponding months this year. However, inflation will remain well above 3% for the whole of 2023 and will not return to target until mid-2024. This forecast assumes that geopolitical tensions do not deteriorate. An escalation of the war in Ukraine and direct involvement of NATO (for example conflict of Russia directly with Poland or the Baltic states) would rapidly deteriorate the picture for inflation. Looking east, if the rising tensions between the US and China lead to an intensification of the trade war or even open military conflict in the South China sea or Taiwan (Republic of China), world supply chains would be disrupted, and inflation significantly raised.
Figure 2: Looking forward to July 2023
For further analysis of current and future prospects for inflation in the UK see:
Will Inflation take off in the UK? The Economics Observatory.
NIESR Economic Outlook Summer 2022
[1] This analysis makes the approximation that the annual inflation rate equals the sum of the twelve month-on-month inflation rates. This approximation ignores “compounding” and is only valid when the inflation rates are low. In future releases I will add on the compounding effect to be more precise at the current high levels of inflation.
Related Blog Posts


Related Projects


Related News


Why it’s not worth worrying that the UK has technically entered a recession
26 Feb 2024
4 min read

1.2 million UK Households Insolvent This Year as a Direct Result of Higher Mortgage Repayments
22 Jun 2023
2 min read

The Key Steps to Ensuring Normal Service is Quickly Resumed in the Economy
13 Feb 2023
4 min read
Related Publications

Recessionary Pressures Receding in the Rearview Mirror as UK Economy Gains Momentum
12 Apr 2024
GDP Trackers
Related events

Summer 2023 Economic Forum

Spring 2023 Economic Forum

Winter 2023 Economic Forum

Autumn 2022 Economic Forum

Summer 2022 Economic Forum

Spring 2022 Economic Forum

Winter 2022 Economic Forum
