Food Prices Keep Inflation at its Historic High
Authors
CPI rose to 9.1% in May from 9.0% in April. Despite a big drop out of 0.6 percentage points from May 2021 the slight increase in CPI inflation reflected the very high level of new inflation between April and May 2022 of 0.7 percentage points. Month on month Inflation remains above the historic norms and we are starting to see the impact of war and sanctions on Food and other sectors. If new inflation continues at this high level, inflation will not drop significantly until 2023 or later. The main contributors to the change in inflation were:
- Food and Non-Alcoholic Beverages: 0.21 percentage points
- Clothing and Footwear: -0.1 percentage points
- Recreation and Culture: -0.13 percentage points
Other sectors made small positive increases which added up to the overall increase of 0.06 percentage points from 9.02% to 9.08% which lead to the increase in headline inflation from 9.0 to 9.1% (the ONS publishes inflation to one decimal place).
Whilst the large increase in inflation in April was mainly driven by domestic energy prices, Food is the main driver keeping inflation high in May. The slight increase in inflation is a mixed story which reflects the base effects from the previous year’s high inflation in April-May 2021. The big increases in April-May 2021 were Clothing & Footwear and Recreation & culture: it is the base effect of these past increases dropping out that is generating the negative contribution to the current month’s inflation despite quite high levels of new inflation this year.
This will be the story for the rest of 2022. Month on month inflation was high for most months in 2021: as we move forward, to sustain or increase the headline inflation level, new inflation will need to come forward to replace that. If the new inflation in 2022 is higher than the old inflation dropping out from 2021, we will see an increase in inflation: if the new inflation is less we will see a decrease. The inflationary story for 2022 will be a tug of war between past inflation pulling down with the new inflation pulling up.
The future path of inflation depends crucially on how the war itself affects the world economy and more importantly the impact of sanctions imposed on Russia by the Western powers. The war and sanctions are having major effects on certain commodities, including wheat and other grains, fertiliser, neon gas, various metals and of course energy (see the March inflation blog for more details).
All of these commodities will be affected to some extent and the ensuing restrictions on supply will be a major driver of inflation in the UK and around the world. Currently, sanctions have been imposed by the “Western powers”, the US, Canada, EU, UK and their close allies in the far East (Japan, South Korea, Australia, NZ, Singapore and Taiwan). The impact of sanctions on the UK economy will also depend on whether secondary sanctions are imposed on the many other countries around the world that continue to trade with Russia (including India and China) and how effective these secondary sanctions are. The more effective the sanctions are, the greater the effect on world supply and hence on inflation. However, given that the EU continues to consume Russian energy it is unlikely that secondary sanctions will be a practical policy tool in the near future.
The continuation of China’s zero covid policy is also having a major impact on the Chinese economy and global supply chains. The WHO has stated that this policy is not sustainable given the highly transmissible variants of Covid currently spreading around the world. However, there is little sign of the Chinese government altering its current policy soon and certainly not before the March 2023 Party congress and expected renewal of Xi Jinping’s Presidency at that date. Whilst the continuing Covid lockdowns are unpopular, the number of covid deaths even from the current milder strains would still be very large given the population of China.
Turning back to the May inflation figures, we can look in more detail at the contributions of the different sectors to overall inflation, we can look at the old inflation dropping out of the annual figure (April-May 2021) and the new monthly inflation dropping in (April-May 2022) and use the expenditure weights to calculate CPI. In the chart below, we show the “dropping out” in blue and the “dropping in” in light brown. The overall effect is the sum of the two and is shown as the burgundy line.
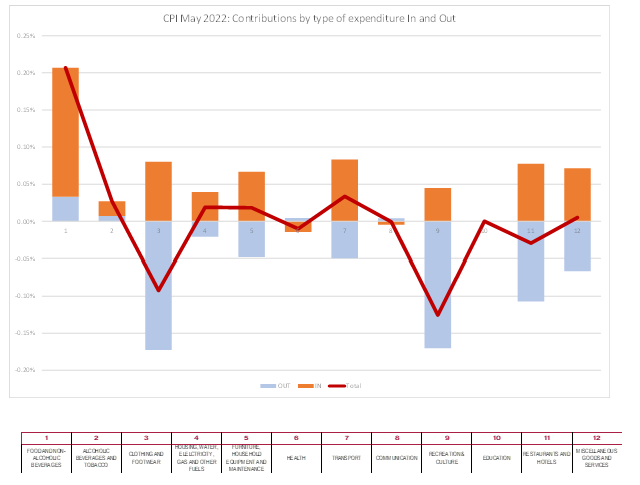
As we can see, the overall effect for most sectors is the result of a tug of war between the blue team pulling downwards as last years inflation drops out whilst the brown team pushes upwards with new inflation. Food & Non-Alcoholic Beverages is the big exception as both the blue and brown point to an increase, as they do on a smaller scale for Alcohol & Tobacco. In Clothing & Footwear and Recreation & Culture the blue team predominates and the incoming increases are outweighed by the outgoing decreases. In most sectors the two forces are more in balance with small net increases and decreases and two sectors with little or no change. This balance is also reflected at the aggregate level as there is only a modest increase in headline inflation.
Extreme Items
Out of over 700 types of goods and services sampled by the ONS, there is a great diversity in how their prices behave. Each month some go up, and some go down. Looking at the extremes, for this month, the top ten items with the highest monthly inflation are:
| Table 1: Top ten items for month-on-month inflation (%), May 2022 | |
| Smart Speaker | 64.75 |
| Airport Parking | 27.07 |
| Roadside Recovery Service | 24.68 |
| Carton/Box Of Chocs 150-400gm | 15.18 |
| CDs- Purch Over Internet | 15.07 |
| Digital Media Player | 15.04 |
| Cream Liqueur 70cl-1lt 14-20% | 13.21 |
| Fresh Veg-Carrots-Per Kg | 13.10 |
| Fruit Drink Bottle 4-8 Pack | 10.95 |
| Kitchen Roll Pk Of 2-4 Specify | 9.95 |
Those going to airports to park who broke down were hit the hardest, especially if their go to comforts were a box of chocolates or cream liqueur.
The ten items with the highest negative inflation this month are shown in Table 2.
| Table 2: Bottom ten items for month-on-month inflation (%), May 2022 | |
| Charcoal BBQ Not Disposable | -7.67 |
| Boys Jeans (5-13 Years) | -8.22 |
| Shower Gel 150-250ml | -8.88 |
| Cheese Spread, 125g-200g Tub | -10.61 |
| Men’s Tracksuit/Jogging Bottoms | -10.69 |
| Internet Computer Games | -10.98 |
| Music Downloads | -11.06 |
| Coach Fares | -12.03 |
| Computer Game Downloads | -16.67 |
| Euro Tunnel Fares | -28.92 |
May was definitely a time to stock up on Barbeques in anticipation of the June heatwave.
In both these tables we look at how much the item price-index for this month has increased since the previous month, expressed as a percentage. These calculations were made by my PhD student at Cardiff University, Yang Li.
Looking Ahead: Ukraine and beyond
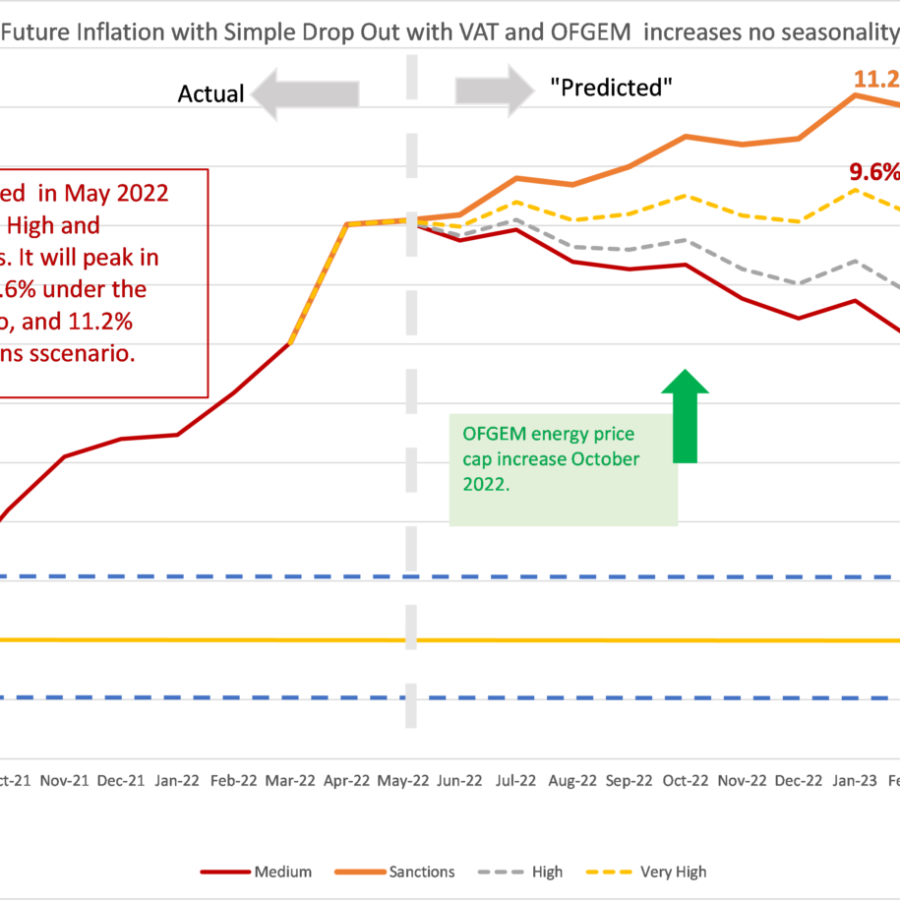
We can look ahead over the next 12 months to see how inflation might evolve as the recent inflation “drops out” as we move forward month by month. Each month, the new inflation enters into the annual figure and the old inflation from the same month in the previous year “drops out”.[1] However, the recent invasion of Ukraine by Russia and the western sanctions in response make things even more uncertain. That said, the invasion and sanctions are certainly going to start increasing inflation as we go forward. We have therefore adjusted our scenarios.
We now use four scenarios.
- The “medium” scenario assumes that the new inflation each month is equivalent to what would give us 2% per annum – 0.17% per calendar month (pcm) – which is both the Bank of England’s target and the long-run average for the last 25 years. This is a reference point only, as inflation will be well above this level for the next year or two.
- The “high” scenario assumes that the new inflation each month is equivalent to 3% per annum (0.25% pcm).
- The “very high” scenario assumes that the new inflation each month is equivalent to 5% per annum (0.4% pcm). This reflects the inflationary experience of the UK in 1988-1992 (when mean inflation was 0.45%). It also reflects the continuation of the UK average for the second half of 2021. This level of month-on-month inflation would indicate a significant break from the historic behaviour of inflation from 1993-2020.
- “Sanctions” scenario. This assumes that new inflation per month is 0.8%, equivalent to 10% per annum. This is a high figure and is unlikely to be sustained for a prolonged period unless geopolitical conditions deteriorate.
We added the “Sanctions” scenario to reflect a lower bound on what we can expect as sanctions and the war itself affect global energy and commodity prices. We have dropped the “low” scenario from previous releases as this is now irrelevant. The “Very high” scenario is probably the central forecast, but of course there is very high uncertainty now.
In addition, we also have additional “drop ins” resulting from government policy: OFGEM. will increase the price-cap at the end of September 2022. With the recent behaviour of energy prices there also seems likely to be a big increase in September 2022 which will show up in the October 2022 inflation figures. We have set this at 1.0% (although it is yet to be announced).
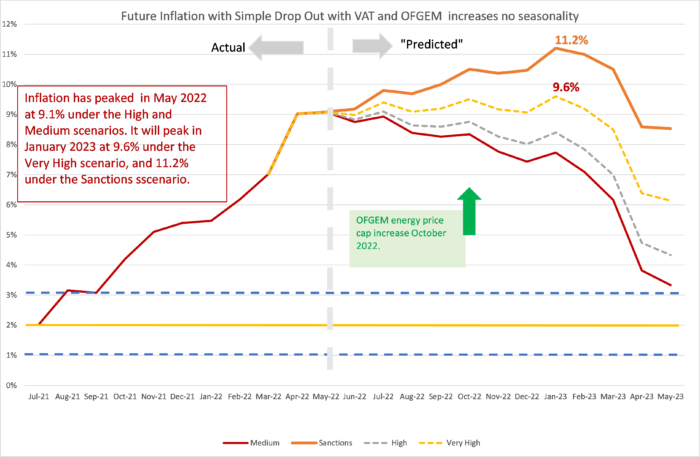
Although inflation only increased slightly in May, it has raised the expected future path of inflation. This was because under most scenarios we expected inflation to fall in May from the April “peak” that had been expected. The peak for the Very High scenario went a little higher (9.1% to 9.6%) and later (July 2022 to January 2023). Under the sanctions scenario the peak remained at January 2023 but increased slightly from 10.9% to 11.2%. The Sanctions scenario seems to be in line with the Bank of England’s May Monetary Policy Report forecast.
In all scenarios, there is a rapid fall in inflation from February 2023, which is due to the drop out of the high inflation figures in the corresponding months this year.
Figure 2: Looking forward to May 2023:
Will Inflation take off in the UK? The Economics Observatory.
“Sailing in Treacherous Seas” – NIESR UK Economic Outlook, Spring 2022
[1] This analysis makes the approximation that the annual inflation rate equals the sum of the twelve month-on-month inflation rates. This approximation ignores “compounding” and is only valid when the inflation rates are low. In future releases I will add on the compounding effect to be more precise at the current high levels of inflation.
Related Blog Posts


Related Projects


Related News


Why it’s not worth worrying that the UK has technically entered a recession
26 Feb 2024
4 min read
Related Publications

Recessionary Pressures Receding in the Rearview Mirror as UK Economy Gains Momentum
12 Apr 2024
GDP Trackers
Related events

Summer 2023 Economic Forum

Spring 2023 Economic Forum

Winter 2023 Economic Forum

Autumn 2022 Economic Forum

Summer 2022 Economic Forum

Spring 2022 Economic Forum

Winter 2022 Economic Forum
