Immigration: recent trends and Thursday’s figures
In advance of the latest batch of migration statistics on Thursday from the Office for National Statistics, I thought it was worth trying to summarise what the vast range of data on immigration tells about recent trends. This is not a particularly analytical piece: for excellent summaries about the economics of immigration to the UK, go to this from Jonathan Wadsworth (CEP) or this from CREAM (UCL).
Authors
In advance of the latest batch of migration statistics on Thursday from the Office for National Statistics, I thought it was worth trying to summarise what the vast range of data on immigration tells about recent trends. This is not a particularly analytical piece: for excellent summaries about the economics of immigration to the UK, go to this from Jonathan Wadsworth (CEP) or this from CREAM (UCL). Both of these, of course, emphasise again the broad consensus among researchers about the economic benefits of immigration, and the surprising lack of evidence of any significant impact, even in the short term, on native jobs and wages. I won’t go through that again.
First, a longer term perspective. This chart shows net migration broken down between three groups: EU citizens, non-EU citizens, and British citizens:
- Non EU immigration began to take off in the 1992 recovery, accelerated again post 1997, fell back after 2004, and then fell further after 2010;
- Net immigration from EU countries was close to zero until 2004, after which it rose sharply, falling back in recession that began in 2008 but rising again after 2009;
- Net emigration by UK citizens is quite variable, but rose in the run up to recession and fell back afterwards.
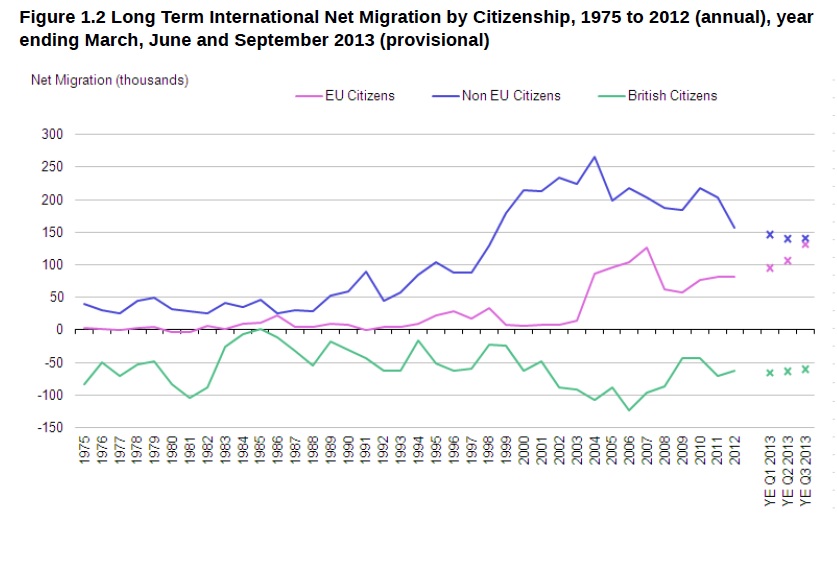
[Source: ONS, Quarterly Migration Report, February 2014]
In this light, how should we interpret recent trends, and what is the respective role of economics, policy and other factors? There is no right answer to this but it is notable that the fall in immigration, especially EU migration, during the recession was considerably less than many economists would have predicted; and the subsequent recovery has been quicker. At the same time, there has been a clear shift from non-EU migration to EU migration. This is partly the result of economic conditions – in particular high youth unemployment in the eurozone – but this is not the only explanation. Net migration from Poland (neither in the eurozone nor in recession) continues.
A good example of how policy has driven this substitution has been seen in the social care sector, as explained here. Pre-2008 or so, many care workers were recruited from outside the EU via the work permit route. Government has taken the view that this is not in fact a high skilled or high paid sector, and has effectively closed off this option. The intention was presumably that employers would improve pay or training for native workers. Given, however, that the ultimate funder of this sector is mostly local authorities – whose funding has been substantially reduced over this period – it is hardly surprising (and indeed, a number of us predicted this at the time) that this response has failed to materialise. The result, therefore, has been substitution from non-EU migrants to EU migrants, not necessarily to the benefit of either service users or British workers.
Looking at the labour market more broadly, one completely misleading statistic that is often highlighted in this debate is the assertion that over various periods migrants have taken (or not) some large fraction of “new jobs”. This confusion of net and gross figures is a very basic error. In fact, migrants generally take a similar, although somewhat higher, proportion of new jobs (about 18% at the moment) as their share of the overall labour force (about 15%).
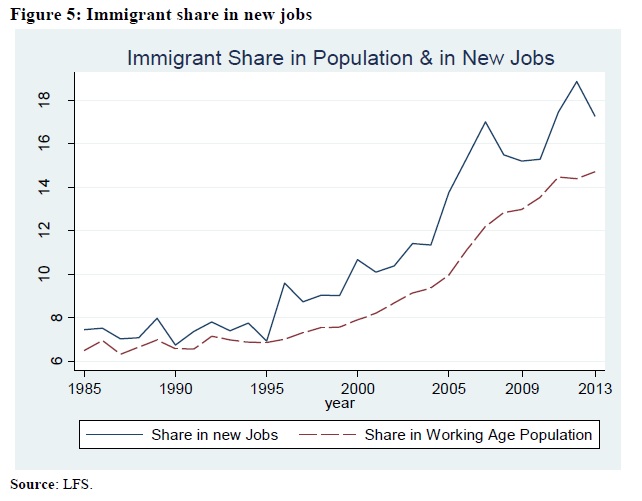
[Source, Jonathan Wadsworth, CEP, using LFS data]
A much better way of looking at net changes than the “proportion of new jobs” nonsense is this fascinating chart from Michael O’Connor shows net changes in employment by country of birth over the past decade.
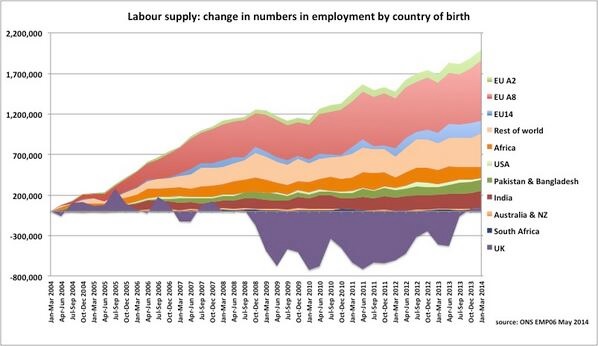
[Source, Michael O’Connor, Stronger in Numbers, using LFS data]
These are net flows, not gross; and proper econometrics would be required to interpret it definitively. But casual inspection suggests that employment for most foreign born groups, especially EU nationals, increased fairly steadily through the period, even the recession; while by contrast employment of UK nationals fell sharply in the recession and then recovered. This might suggest that migrant employment is if anything somewhat less cyclical than native employment, contrary to previous assumptions. It also might imply that, as other research has suggested, migrant workers and native workers often operate in different labour markets rather than necessarily competing (the labour market segmentation hypothesis).
So what might happen next and what should we be looking for in Thursday’s figures? A lot of attention will be devoted to EU migration. But in my view developments in non-EU migration may be more interesting. So far, the direct impacts have been quite mixed:
- The crackdown on non-HE students has undoubtedly reduced abuse, but at the same time has done severe damage to a successful export sector. Meanwhile, the HE sector has now largely adapted to most of the changes. It has lost international market share (another hit to exports) but has not been terminally damaged;
- The restrictions on students staying on through the Post-Study Work Route were again designed to address abuse but have also made the UK considerably less attractive, particularly to the “brightest and best” that the government ostensibly wishes to attract and retain (unsurprisingly, the “graduate entrepreneur” route is a bureaucratic mess).
- The cap on skilled workers has not been reached, partly because the recession reduced demand and partly because other changes – and Home Office bureaucracy and system failures – have made this route less attractive to businesses, especially those that can’t afford large compliance departments.
This chart shows visa issuance by main category (work, study, family/dependent).
.jpg)
[Source: Author’s calculations from Home Office Immigration Statistics, February 2014. Four quarter moving total.]
The fall in work visas post 2007, and in study post 2010, is clearly evident. But the reduction in flows from these changes appears, in the latest figures, to have flattened off. So what happens next? In particular, will economic recovery, and emerging skill shortages in parts of the labour market, see increased flows of non-EU migrants for work visas? And if so, how will the government respond? Will it further tighten the system at expense of the wider economy (not to mention the Exchequer)? Or will it find a way of relaxing or bypassing the cap in response to pressures from business, particularly given that the public seems relatively relaxed (as it should be) about high skilled migrants coming to fill jobs where there is demand? Given the recent strength of the labour market, Thursday’s figures may provide some clues of emerging pressure points.
Finally, one bit of the immigration system that doesn’t always get the attention that it deserves is settlement and citizenship. In 2013 more than 208,000 applications for British citizenship were approved – an all time record. As the Census showed, British identity is extremely high among most immigrant communities in the UK, even those that have arrived relatively recently; this seems to be manifesting itself very concretely in the desire to become British.
Related Blog Posts


What Are the Implications of the Rising National Minimum Wage and National Living Wage Rates?
19 Mar 2024
5 min read


Related Projects


Related News


Press Release: Compositional effects push up average weekly earnings at the end of 2020
26 Jan 2021
2 min read
Press Release: 2020 shaping up to be the worst year for total pay growth since 2009
15 Dec 2020
2 min read
Related Publications

Pay-Setting Among Employers in the Agriculture, Cleaning, Hospitality and Retail Sectors
11 Mar 2024
Research Report

Job Boom or Job Bust? The Effect of the Pandemic on Actual and Measured Job and Employment Growth
07 Feb 2024
UK Economic Outlook Box Analysis

Kurzarbeit/Short Time Working: Experiences and Lessons from the Covid-Induced Downturn
20 Nov 2023
National Institute Economic Review

Related events
