Inflation Rises to 10.4 per cent with a Bounce Back from the Big January Sales
CPI inflation rose to 10.4 per cent in February from 10.1 per cent in January. The new inflation coming in between January and February was 1.1 per cent, which outweighed the drop out of 0.8 per cent from the previous February. How might inflation evolve over 2023 as we move forward month by month? Huw Dixon, Head of Economic Measurement at NIESR, explores some of the underlying figures.
Authors
CPI inflation rose to 10.4 per cent in February from 10.1 per cent in January. The new inflation coming in between January and February was 1.1 per cent, which is a very high figure and outweighed the drop out of 0.8 per cent from the previous February. Some of this is clearly a one-off recovery from the larger than usual January sales.
Month on month inflation was positive for 11 out of the 12 types of expenditure and zero for 1. Combining the drop-ins with the drop outs from Jan-Feb 2022, the sectors making the largest contribution to the increase in February were:
- Restaurants and Hotels 0.2 percentage points
- Food and non-Alcoholic Beverages 0.15 percentage points
- Clothing and Footwear 0.11 percentage points
- Recreation and culture -0.11 percentage points
Month on month inflation was extremely high from March to May 2022, so, as we move forward into 2023, inflation will tend to fall as these big increases drop out. The tug of war between the new inflation dropping in and the old inflation dropping out will mostly see the old inflation winning and inflation falling. However, there may be exceptions such as this month where the new inflation is high enough. However, between December and January we saw a big drop in prices so that the increase in inflation in February reflects a “bounce back” effect as prices recovered from the big discounts in January.
To understand the “bounce back” more easily, it is best to look at the CPI price level. In the next figure we show the CPI index over the 5 months from October 2022 to Feb 2023. The thick blue line is the actual CPI level which dipped in January: prices were lower in January 2023 than they had been in December 2022. The dotted light blue line continues the trend from October to December.
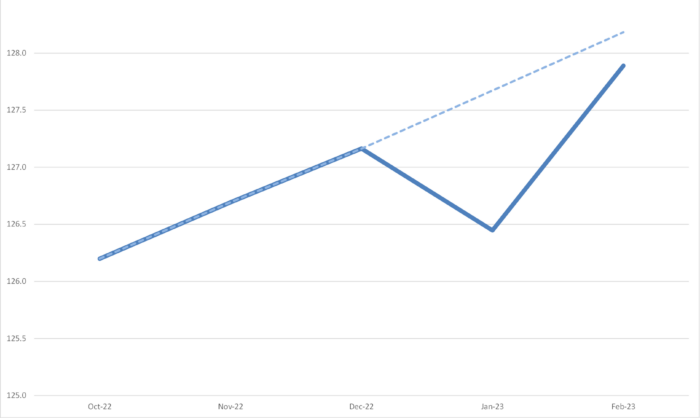
As we can see, if we combine the fall in prices in January with the increase in February, we are still below the trend at the end of 2022. For the two months October – December 2022 there was 0.8 per cent inflation, whilst if we look over the two months December 2022 – February 2023 there was just 0.5 per cent. Thus, the large month-on-month figure of 1.1 per cent is best seen as “bounce back” and does not indicate an intensification of inflationary pressures. However, if inflation in March is also at a high level, then that would call for a revisiting of this judgement.
Looking forward, unless geopolitical issues deteriorate substantially, it seems likely that new inflation will eventually become more in line with historic averages. The future path of inflation will depend on how the Russo-Ukrainian war affects the world economy and the impact of sanctions imposed on Russia by the Western powers. On December 5th, the G7 and EU introduced a price-cap of $60 per barrel on exports of Russian oil. The main mechanism to enforce this is via the provision of insurance and other services by companies in the G7 and EU. (Details of the UK implementation are detailed in Russian oil services ban.) The idea is that when the price-cap is operating, the G7 and EU countries can insure and provide services to expedite the supply of Russian oil and hence avoid a reduction in the world oil supply. World oil prices remain subdued and there seems to be little expectation in the market of future increases. This indicates that the policy may have been effective in avoiding a reduction in world oil supply. Food is more of a concern, and whilst the Black Sea deal brokered by Turkey and the UN has been extended and continues to enable the export of Ukrainian grains, there still seem to be difficulties in exports of Russian and Belorussian food and fertiliser. Fertiliser, like energy, has fallen from its peaks of mid-2022, but still remains well above historic levels. Both energy and fertiliser are significant input costs for agriculture around the world.
The supply of natural gas is highly inelastic in the short run as is the demand. Reductions in Russian supply led to dramatic rises in gas prices in 2022 and an increase in expenditure and hence the revenue of gas suppliers. Thankfully, the recent mild weather in western Europe partially reversed this and the price of gas has declined significantly in recent months and is currently below the levels seen in 2022. The Energy Price Guarantee (EPG) continues to contain inflation across the UK and the cancellation of the increase in April will reinforce the downward trend in inflation through 2023. A slowdown in growth in the World as the cost-of-living crisis affects real incomes and leads to a reduction in discretionary consumer expenditure will lead to a further decline in some commodity and energy prices across the world which will also mitigate the inflationary pressures somewhat.
The Chinese government’s ending of the zero-Covid policy continues to be a positive development in freeing up world supply chains originating in or passing through China in 2023, which is also having a downward effect on inflation.
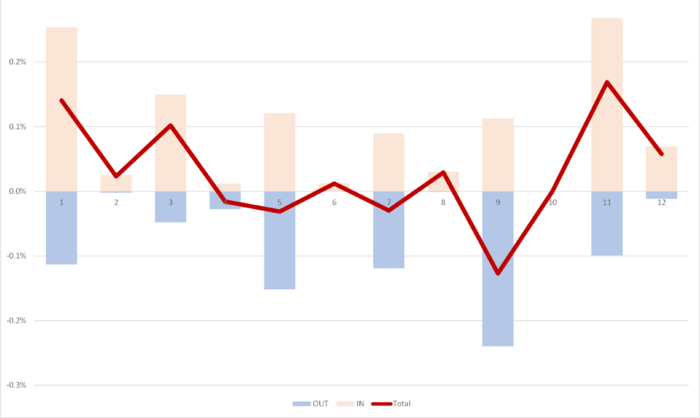
Turning back to the October inflation figures, we can look in more detail at the contributions of the different sectors to overall inflation in the chart below, with the old inflation dropping out of the annual figure (November-December 2021) shown in blue and the new monthly inflation dropping in (November-December 2022) shown in Brown, using the expenditure weights to calculate CPI. The overall effect is the sum of the two and is shown as the burgundy line.
We can see that for most types of expenditure, there are big drop-outs from the previous year (the Blue team) but the drop-ins (the Brown team) are even bigger. The Brown team has clearly won the tug of war this month, with the big increases in Restaurants and Hotels, Food and Non-Alcoholic Beverages, Clothing and Footwear leading to an across-the-board win pushing up inflation 0.3 percentage points overall.

In January and February 2023 the expenditure weights for expenditure types were altered. These reflect the spending patterns of the previous year, so the 2023 weights are based on 2022 expenditures and 2022 weights on 2021 expenditures.
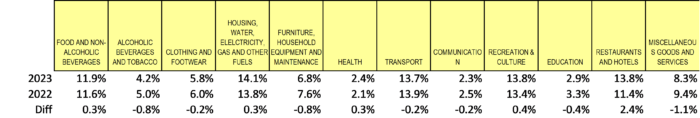
Note that the expenditure shares for each year (row) add up to 100% and that the difference in the bottom row is the 2023 figure minus the 2022 figure and the differences add up to 0%. A s we can see, the biggest differences were an increase in the share of Restaurants and Hotels, Recreation and Culture, Housing Water and Electricity, Health and Food and Non-Alcoholic Beverages. The biggest falls were in Alcohol and Tobacco, Furniture and Household Equipment and Miscellaneous Goods and Services.
Extreme Items
Out of over 700 types of goods and services sampled by the ONS, there is a great diversity in how their prices behave. Each month some go up, and some go down. Looking at the extremes, for this month, the top ten items with the highest monthly inflation are:
| Table 1: Top ten items for month-on-month inflation per cent), Feb 2023 | |
| MUSIC DOWNLOADS | 38.85 |
| ROADSIDE RECOVERY SERVICE | 32.92 |
| MENS BRANDED T-SHIRT | 32.70 |
| MONEY TRANSFERS | 26.20 |
| PERSONAL COMPUTERS (CPI) | 17.77 |
| COACH FARES | 17.33 |
| EURO TUNNEL FARES | 15.71 |
| TELEVISION 39″ OR SMALLER | 15.32 |
| COMPUTER GAME 2 | 14.97 |
| MEN’S FOOTBALL BOOTS | 14.15 |
A tough month for travellers wanting to download music.
The ten items with the highest negative inflation this month are shown in Table 2.
| Table 2: Bottom ten items for mom inflation ( per cent), Feb 2023 | |
| OLIVE OIL – 500ML – 1 LITRE | -28.71 |
| MASCARA | -29.56 |
| CANNED SOUP-390-425G | -29.70 |
| SUGAR -GRANULATED-WHITE-PER KG | -30.07 |
| MILK SEMI-PER 2 PINTS/1.136 L | -31.10 |
| KEROSENE – 1000L DELIVERED | -32.15 |
| MAYONNAISE 390-500G/420-540MLS | -32.81 |
| CERAMI TILES 15X15-25X50CM BOX | -34.21 |
| EBOOKS | -38.27 |
| MEN’S BRANDED SPORT SWEATSHIRT | -45.95 |
A great month for olive oil, mascara and sweatshirts.
In both these tables we look at how much the item price-index for this month has increased since the previous month, expressed as a percentage. These calculations were made by my PhD student at Cardiff University, Yang L
Looking Ahead: Ukraine and beyond
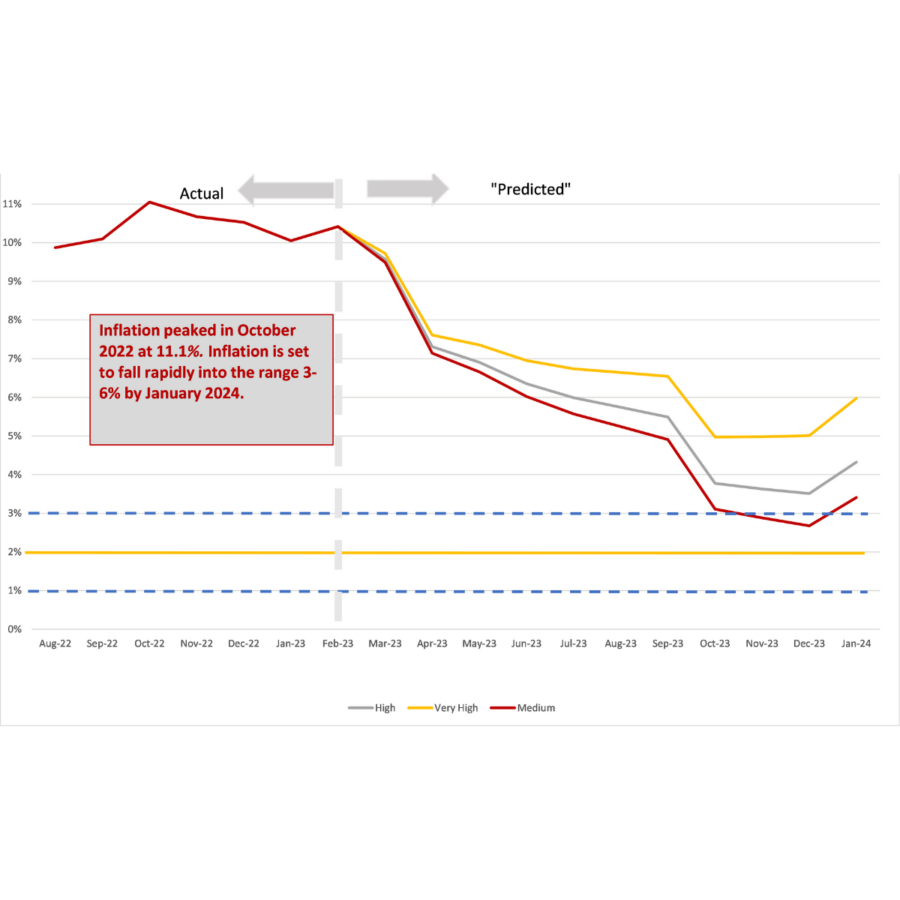
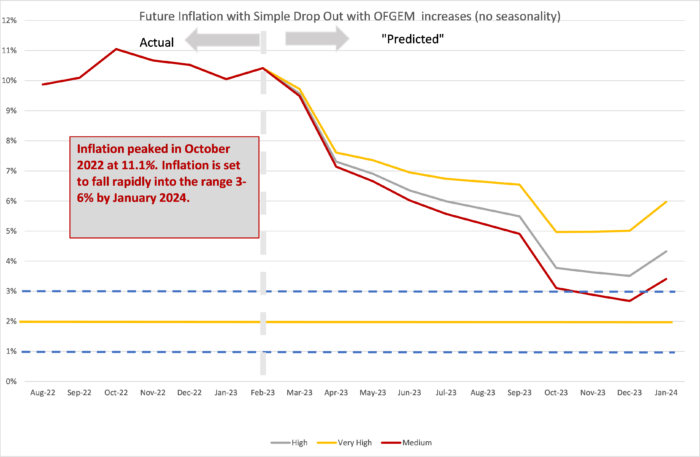
We can look ahead over the next 12 months to see how inflation might evolve as the recent inflation “drops out” as we move forward month by month. Each month, the new inflation enters the annual figure and the old inflation from the same month in the previous year “drops out”. However, the invasion of Ukraine by Russia and the western sanctions in response continue to make things uncertain. That said, the world economy seems to have adapted to the dislocation caused as supply chains are re-routed and the effect seems to be abating and is not as bad as some had feared. We have therefore ended the “Sanctions scenario” introduced last March in response to the invasion. We depict the following scenarios for future inflation dropping in:
- The “medium” scenario assumes that the new inflation each month is equivalent to what would give us 2 per cent per annum – 0.17 per cent per calendar month (pcm) – which is both the Bank of England’s target and the long-run average for the last 25 years. This is a reference point only, as inflation will be well above this level for the next year.
- The “high” scenario assumes that the new inflation each month is equivalent to 3 per cent per annum (0.25 per cent pcm).
- The “very high” scenario assumes that the new inflation each month is equivalent to 5 per cent per annum (0.4 per cent pcm). This reflects the inflationary experience of the UK in 1988-1992 (when mean inflation was 0.45 per cent). It also reflects the continuation of the UK average in the second half of 2021. This level of month-on-month inflation would indicate a significant break from the historic behaviour of inflation from 1993-2020.
In recent months our central forecast was the “very high scenario”. However, as inflationary pressures fall, we will adjust our central forecast to the “high” and hopefully later on back to the historic “medium” scenario consistent with 2 per cent annual inflation.
We have dropped the “low” scenario from previous releases as this is still likely to irrelevant for 2023. In all scenarios, there is a rapid fall in inflation from February 2023, which is due to the drop out of the high inflation figures in the corresponding months this year. However, inflation will remain well above 2 per cent for the whole of 2023 and possibly close to 6%. The up-tick on inflation in January 2024 will depend on the size of the January sales that year, and may even show a decrease (the size of the January sales effect varies considerably from year to year).
This forecast assumes that geopolitical tensions do not deteriorate. Direct conflict between Russia and NATO would rapidly worsen the picture for inflation. Looking east, if the rising tensions between the US and China lead to an intensification of the trade war or even open military conflict in the South China sea or Republic of China (Taiwan), world supply chains would be disrupted, and inflation significantly raised. However, the recent local elections in Taiwan, with good results for the opposition KMT party – which supports the “one China” policy and opposes the separatist government – suggests that the Taiwan issue may calm down for some time (at least until elections in 2024). There may be a negotiated settlement to end the war in Ukraine in 2023, which would stabilise the economic situation and lead to a further reduction in commodity and energy prices, especially if sanctions on Russia are eased as part of the settlement.
Looking forward to December 2023…
Related Blog Posts
Related Publications
Unexpected Rise in Inflation Complicates Tomorrow’s MPC Decision
22 Mar 2023
CPI Trackers