Inflation Set to Fall in Early 2023
 Post Date
 Reading Time
Authors


CPI rose to 11.1% in October from 10.1% in September. There was a big drop out of 1% from the previous October 2021 reflecting the large OFGEM price-cap increase that month, so that the increase represents the difference between the new inflation in September-October 2022 of 2%, which was also driven largely by the latest OFGEM price-cap increase, compared to the drop out from 2021. This increase was despite the effect of the Energy Price Guarantee (EPG) which mitigated considerably what would have been an even larger increase in the OFGEM price cap.
Month on month Inflation remains well above the historic norms and is now positive for all types of expenditure. The three main contributors to the change in annual inflation in October were:
- Housing and energy 93%
- Food and Non-Alcoholic Beverages 18%
- Transport -0.23%
The big effect of transport was due largely to base effect of inflation dropping out from October 2021.
Month on month inflation was high for August 2021 to May 2022 (with the exception of January). So, as we move forward into the closing months of 2022 and into 2023, to sustain or increase the headline inflation level, new inflation will need to come forward to replace what drops out from 2021/2. If the new inflation in 2022/3 is higher than the old inflation dropping out from 2021/2, we will see an increase in inflation; if the new inflation is lower, we will see a decrease. The inflationary story for the remainder of 2022 and into 2023 will be a tug of war between past inflation pulling down with the new inflation pulling up. However, with the EPG in place inflation is unlikely to rise much further and will tend to fall in 2023 although remaining well above the 2% target under the more plausible scenarios.
The most important development in the last month was the implementation of the new EPG. The price of Electricity and Gas will be fixed from October 2022 for 6 months (though, at that point it will be replaced by something, hopefully to be announced tomorrow). There was an increase of 27% in the OFGEM price cap reflected in the October inflation figure. This is large, but much smaller than the 80% previously announced by OFGEM. The EPG will also prevent the subsequent OFGEM price cap increases previously anticipated for January and, hopefully, April 2023. If sustained, this can have a very significant effect on the future path of inflation, reducing it by 3-4 percentage points over 2023. Whilst Liz Truss announced that the EPG would last for two years, Rishi Sunak has been more cautious calling for a review after 6 months. If the EPG is ended before energy prices subside, there may be further big increase going forward. The price of natural gas has fallen substantially since September, which may indicate that the EPG might cost less than anticipated. This is not the place to discuss the EPG in detail, but it is not targeted at poorer households, rather applying to all energy consumers. NIESR have proposed a ‘variable price cap’ scheme that would be better targeted, less costly, and incentivise reductions in energy usage. The previously announced £400 discount still applies but does not alter CPI inflation since it is in effect a transfer payment not a reduction in the unit price.
The future path of inflation will also depend on how the Russo-Ukrainian war affects the world economy and more importantly the impact of sanctions imposed on Russia by the Western powers. The G7 and EU are planning to impose a price-cap on Russian oil. The idea is that when the price-cap is operating, European and other countries can insure and transport Russian oil and avoid a reduction in the world oil supply. However, it is yet to be seen if non-Western economies such as India and China will be willing to go along with the policy. The US Treasury has delayed the start date from December 5th to January 19th for the price-cap, but, as yet, no details have been announced. The general principle is that the greater the effect of sanctions on world supplies, the greater the effect on prices and hence inflation. The price-cap is seen as a way of avoiding a reduction in world supply. However, the decision of OPEC+ to reduce oil supply indicates that the world oil supply is set to fall and the price of oil remain high. However, the price-cap may still reduce the price Russia can charge for its oil even if it is less than completely successful.
The supply of natural gas is highly inelastic in the short run as is the demand. Reductions in Russian supply have led to a dramatic rise in price and an increase in expenditure and hence the revenue of gas suppliers. Whilst the EPG will reduce CPI inflation in the UK, it will not increase the supply of natural gas, or the real price (net of the subsidy) paid to gas suppliers. This will mean that the EPG makes energy shortages and power cuts more likely as the subsidy will mean that demand will remain high and with the same supply this may imply rationing by power cuts (depending on the weather in the coming months). In the longer run (3-5 years) it will be possible to replace most Russian gas across the EU, for example with a new pipeline for Israeli gas and with more expensive LNG from a variety of sources. In the shorter run, some European governments, including Germany, are reversing the phasing out of coal-fired and nuclear power stations to try to fill the short-run gap.
However, a positive effect of the increase in the fossil fuel price is that it will speed up the transition to renewable and other alternatives. Also, the slow-down in economic activity it causes serves naturally to reduce the emissions of carbon. More widely, a slowdown in growth in the World as the cost-of-living crisis affects real incomes and leads to a reduction in discretionary consumer expenditure may lead to a decline in some commodity and energy prices across the world. This may mitigate the inflationary pressures somewhat, and we have already seen with petrol prices in the UK.
China’s zero covid policy has had a major impact on the Chinese economy and global supply chains in 2022. The Chinese government has started to gradually ease the zero covid policy, under the new policy dubbed “dynamic” zero covid. This is a positive development, although it remains to be seen how rapidly it leads to a freeing up of world supply chains originating in or passing through China.
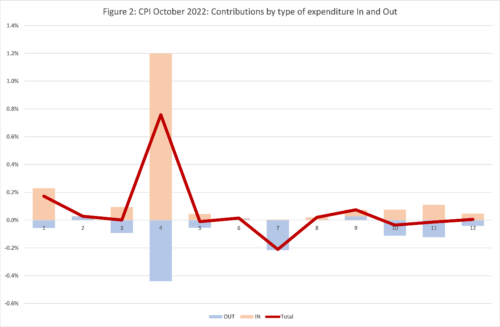
Turning back to the October inflation figures, we can look in more detail at the contributions of the different sectors to overall inflation in Figure 2, with the old inflation dropping out of the annual figure (September-October 2021) shown in brown and the new monthly inflation dropping in (September-October 2022) shown in Blue, using the expenditure weights to calculate CPI. The overall effect is the sum of the two and is shown as the burgundy line.
We can see that for most types of expenditure, there are significant drop-outs from the previous year (the Blue team) and drop-ins from the current year (the Brown team). The change in inflation is the result of the tug-of-war between the Blue and Brown teams, and this will continue for the rest of 2022 and beyond. October is of course dominated by energy, where a big drop out was overwhelmed by an even bigger drop in. The same story holds for Food. The big outlier is Transport, where the blue team won and succeeded in pulling inflation down. However, in other sectors the balance between the teams was more even with the burgundy line being slightly below or above zero.

Extreme Items.
Out of over 700 types of goods and services sampled by the ONS, there is a great diversity in how their prices behave. Each month some go up, and some go down. Looking at the extremes, for this month, the top ten items with the highest monthly inflation are:
| Table 1: Top ten items for month-on-month inflation (%), October 2022 | |
| MOBILE PHONE APPLICATIONS | 55.64 |
| GAS | 37.55 |
| COMPUTER GAME DOWNLOADS | 22.44 |
| EBOOKS | 22.33 |
| STRAWBERRIES PER KG OR PUNNET | 19.41 |
| DRIED POTTED SNACK 50-120G | 17.15 |
| ELECTRICITY | 16.92 |
| ELECTRIC HAIR STYLING APP | 13.07 |
| CDS- PURCH OVER INTERNET | 12.94 |
| TOMATO KETCHUP BOTTLE 340-570G | 11.79 |
Mobile Phone apps and computer game downloads price increases hit hard this month. The ten items with the highest negative inflation this month are shown in Table 2.
| Table 2: Bottom ten items for mom inflation (%), October 2022 | |
| MONEY TRANSFERS | -7.72 |
| ATTRACTIONS | -7.78 |
| GOLF GREEN FEES | -9.02 |
| SMART SPEAKER | -9.33 |
| PRIVATE HEALTH CARE 1 | -9.99 |
| PRIVATE HEALTH CARE 3 | -9.99 |
| DIGITAL MEDIA PLAYER | -10.91 |
| MUSIC DOWNLOADS | -14.35 |
| COMPUTER GAME 2 | -15.82 |
| MEN’S FOOTBALL BOOTS | -16.37 |
A good month for golfers who were able to enjoy the mild weather.
In both these tables we look at how much the item price-index for this month has increased since the previous month, expressed as a percentage. These calculations were made by my PhD student at Cardiff University, Yang Li.
Looking Ahead: Ukraine and beyond
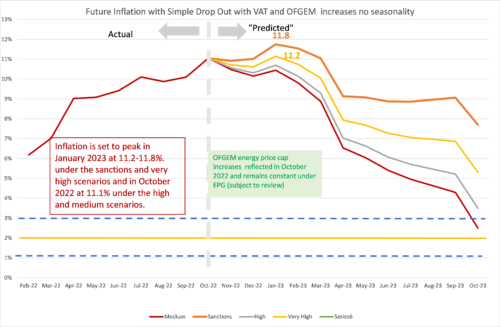
We can look ahead over the next 12 months to see how inflation might evolve as the recent inflation “drops out” as we move forward month by month. Each month, the new inflation enters the annual figure and the old inflation from the same month in the previous year “drops out”.[1] However, the invasion of Ukraine by Russia and the western sanctions in response continue to make things more uncertain. That said, the invasion and sanctions are certainly going to continue to sustain inflation as we go forward. We have therefore adjusted our four scenarios:
- The “medium” scenario assumes that the new inflation each month is equivalent to what would give us 2% per annum – 0.17% per calendar month (pcm) – which is both the Bank of England’s target and the long-run average for the last 25 years. This is a reference point only, as inflation will be well above this level for the next year.
- The “high” scenario assumes that the new inflation each month is equivalent to 3% per annum (0.25% pcm).
- The “very high” scenario assumes that the new inflation each month is equivalent to 5% per annum (0.4% pcm). This reflects the inflationary experience of the UK in 1988-1992 (when mean inflation was 0.45%). It also reflects the continuation of the UK average in the second half of 2021. This level of month-on-month inflation would indicate a significant break from the historic behaviour of inflation from 1993-2020.
- “Sanctions” scenario. This assumes that new inflation per month is 0.8%, equivalent to 10% per annum. This is a high figure, which is unlikely to be sustained for a prolonged period unless geopolitical conditions deteriorate.
We have added the “Sanctions” scenario since March 2022 to reflect what we can expect as sanctions and the war itself affect global energy and commodity prices. We have dropped the “low” scenario from previous releases as this is now irrelevant. The “Very high” scenario is probably the central forecast, but of course there is very high uncertainty now. Month on month inflation has averaged over 1% since February 2022.
In addition, we assume that the EPG will be sustained for at least 12 months.
In all scenarios, there is a rapid fall in inflation from February 2023, which is due to the drop out of the high inflation figures in the corresponding months this year. However, inflation will remain well above 3% for the whole of 2023 and NIESR’s current forecast is that it will not return to target until mid-2025. This forecast assumes that geopolitical tensions do not deteriorate. An escalation of the war in Ukraine and direct involvement of NATO (for example conflict of Russia directly with Poland – a higher possibility now given the events of yesterday – or the Baltic states) would rapidly deteriorate the picture for inflation. Looking east, if the rising tensions between the US and China lead to an intensification of the trade war or even open military conflict in the South China sea or Taiwan (Republic of China), world supply chains would be disrupted, and inflation significantly raised.
The “Peak” in January may not happen, depending on how big the seasonal January sales are.
Figure 3: Looking forward to August 2023
[1] This analysis makes the approximation that the annual inflation rate equals the sum of the twelve month-on-month inflation rates. This approximation ignores “compounding” and is only valid when the inflation rates are low. In future releases I will add on the compounding effect to be more precise at the current high levels of inflation.
Related Blog Posts


Related Projects


Related News


Why it’s not worth worrying that the UK has technically entered a recession
26 Feb 2024
4 min read
Related Publications

Recessionary Pressures Receding in the Rearview Mirror as UK Economy Gains Momentum
12 Apr 2024
GDP Trackers
Related events

Summer 2023 Economic Forum

Spring 2023 Economic Forum

Winter 2023 Economic Forum

Autumn 2022 Economic Forum

Summer 2022 Economic Forum

Spring 2022 Economic Forum

Winter 2022 Economic Forum
