Inflation Surged in February Across Most Consumer Items, With More to Come as War and Sanctions Take Their Effect
Authors
CPI rose to 6.2% in February from 5.5% in January. Month on month inflation between January and February was very high at 0.8%. There is usually a seasonal February bounce back in prices after the January sales, but this is much larger than usual. The previous “bounce” from February 2021 dropped out and reduced the increases in headline inflation by 0.1%.
The surge in inflation is across all types of consumer expenditure. Whilst all sectors have showed an increase, the main contributors to the surge in inflation are
- Recreation and Culture (0.25%)
- Clothing and Footwear (0.17%)
- Food and Non-Alcoholic Beverages (0.09%)
The surge in prices in February shows that inflation is becoming entrenched. Food in particular has been rising rapidly since September 2021. Prior to the outbreak of war in Ukraine, we expected inflation to peak in April 2022 with the OFGEM price cap being raised.
The future path of inflation depends crucially on how the war itself affects the world economy and more importantly the impact of sanctions. The war and sanctions will have major effects on certain commodities:
- Wheat and other grains: Russia and the Ukraine are major exporters of Wheat and prices started to increase even before hostilities started.
- Fertilizer: the price has already spiked in anticipation of future shortages. Belarus/Russia and Ukraine produce a large amount of it. Russia is 20% of world supplies plus ingredients to make it elsewhere (urea, ammonia, and potash). This will increase the cost of food across the globe.
- Neon: About 50% of the world’s semiconductor-grade neon, critical for the lasers used to make microchips, smart phones etc, comes from two Ukrainian companies, Ingas and Cryoin. Ingas is based in Mariupol and Cryonin in Odessa. World stocks will run out in April.
- Metals: Russia is a significant producer of Gold, Nickell, Palladium, copper and Aluminium.
- Energy: Russia is a major supplier of oil and natural gas.
How the war and sanctions play out will determine exactly what happens in each case. However, it is certain that all of these commodities will be affected to some extent and that restrictions on supplies will be a major driver of inflation in the UK and around the world.
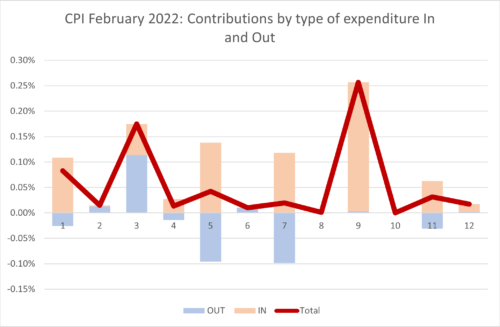
Turning back to the February inflation figures, we can look in more detail at the contributions of the different sectors to overall inflation, we can look at the old inflation dropping out of the annual figure (Jan-Feb 2021) and the new monthly inflation dropping in (Jan-Feb 2022) and use the expenditure weights to calculate CPI. In the chart below, we show the “dropping out” in blue and the “dropping in” in light brown. The overall effect is the sum of the two and is shown as the burgundy line.
Recreation and Culture had the largest impact overall and this was almost entirely “new inflation” dropping in. Looking in finer detail, this was driven in part by very large increases in audio-visual equipment, sports and outdoor equipment, and books but was also fairly general within this category. The impact of Clothing and Footwear was mainly due to the dropping out effect from Jan-Feb 2021, itself a “bounce back” effect from the January 2021 sales. There was also some modest new inflation added for Jan-Feb 2021. The contribution to the increase in Food and Non-Alcoholic Beverages was due to new inflation (slightly counteracted by a negative drop out effect from the previous year). Food prices are increasing across the world as shortages have developed in the last quarter of 2021 and look set to continue and get worse due to the war and sanctions.

Extreme Items.
Out of over 700 types of goods and services sampled by the ONS, there is a great diversity in how their prices behave. Each month some go up, and some go down. Looking at the extremes, for this month, the top ten items with the highest monthly inflation are:
| Table 1:Top ten items for month-on-month inflation (%), Feb 2022 | |
| SRVYRS FEES MORTGAGE VALUATION | 60.72 |
| INTERNET DVDS | 42.24 |
| COMPUTER GAME 3 | 38.79 |
| COACH FARES | 37.80 |
| COMPUTER GAME 2 | 33.49 |
| DISHWASHER TABLETS PACK 16-45 | 29.51 |
| INTERNET COMPUTER GAMES | 28.06 |
| CDS- PURCH OVER INTERNET | 26.11 |
| WOMENS SHORT SLEEVE SPORTS TOP | 25.90 |
| MONEY TRANSFERS | 22.32 |
The ten items with the highest negative inflation this month are shown in Table 2.
| Table 2: Bottom ten items for mom inflation (%), Feb 2022 | |
| 2-YEAR-OLD SECOND-HAND CAR | -22.21 |
| 3-YEAR-OLD SECOND-HAND CAR | -22.93 |
| KEROSENE – 1000L DELIVERED | -24.04 |
| STRAWBERRIES PER KG OR PUNNET | -24.05 |
| ELECTRIC HEATER -SEASONAL | -25.48 |
| HOUSE CONTENTS INSURANCE | -28.05 |
| MENS 3/4 TO FULL LENGTH COAT | -29.49 |
| SELF-DRIVE CAR HIRE BASIC 24HR | -35.38 |
| MARGARINE/LOW FAT SPREAD-500G | -37.90 |
| MDF | -41.52 |
In both these tables we look at how much the item price-index for this month has increased since the previous month, expressed as a percentage. These calculations were made by my PhD student at Cardiff University, Yang Li.
Looking Ahead: Ukraine and beyond
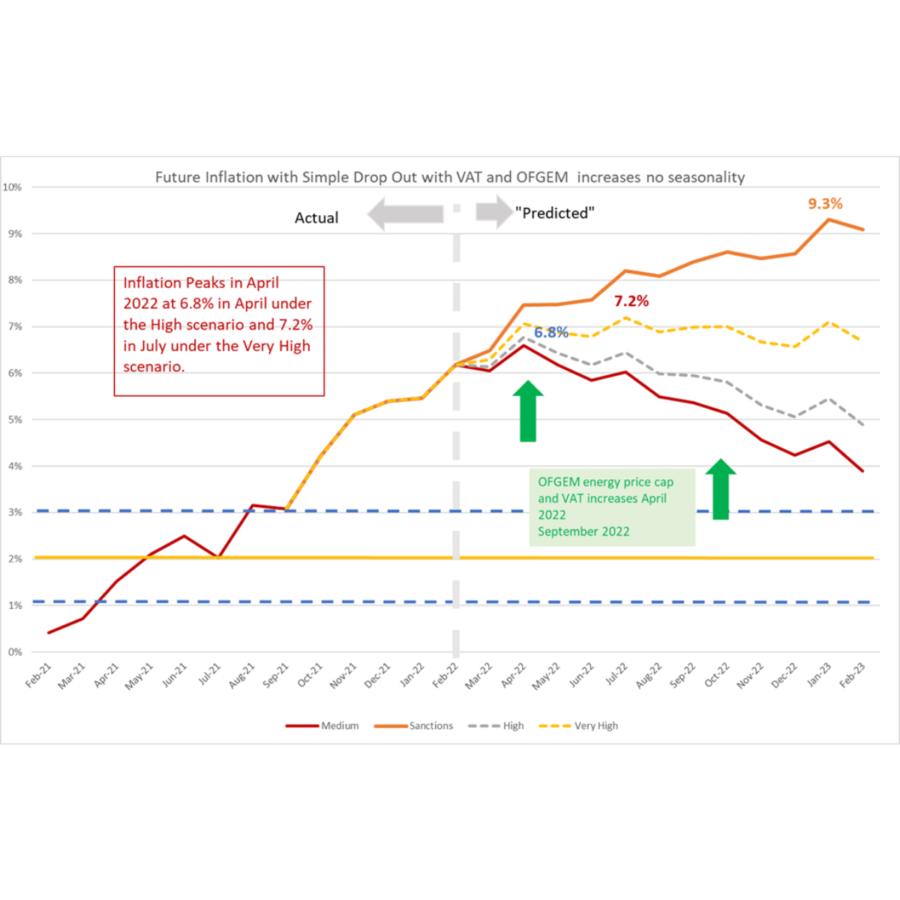
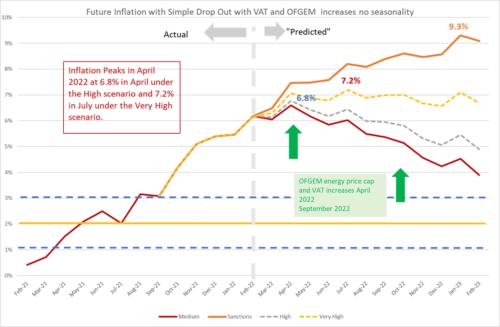
We can look ahead over the next 12 months to see how inflation might evolve as the recent inflation “drops out” as we move forward month by month. Each month, the new inflation enters into the annual figure and the old inflation from the same month in the previous year “drops out”.[1] However, the recent invasion of the Ukraine by Russia and the western sanctions in response makes things even more uncertain. That said, the invasion and sanctions are certainly going to start increasing inflation from March onwards. We have therefore adjusted our scenarios.
We do this under four scenarios.
- The “medium” scenario assumes that the new inflation each month is equivalent to what would give us 2% per annum – 0.17% per calendar month (pcm) – which is both the Bank of England’s target and the long-run average for the last 25 years. This is a reference point only, as inflation will be well above this level for the next year or two.
- The “high” scenario assumes that the new inflation each month is equivalent to 3% per annum (0.25% pcm).
- The “very high” scenario assumes that the new inflation each month is equivalent to 5% per annum (0.4% pcm). This reflects the inflationary experience of the UK in 1988-1992 (when mean inflation was 0.45%) or recent US experience. It also reflects the continuation of the current UK average in recent months. This level of month-on-month inflation would indicate a significant break from the historic behaviour of inflation from 1993-2020.
- “Sanctions” scenario. This assumes that new inflation per month is 0.6%, equivalent to 7% per annum. Of course, this assumption is quite conservative and some commentators are suggesting even higher inflation over the coming months as a result of the war in Ukraine and ensuing economic sanctions
We have added the “Sanctions” scenario to reflect a lower bound on what we can expect as sanctions and the war itself affect global energy and commodity prices. We have dropped the “low” scenario from previous releases as this is now irrelevant. The “Very high” scenario is probably the central forecast, but of course there is very high uncertainty now.
In addition, we also have additional “drop ins” resulting from government policy:
- The reversal of the July 2020 reduction of VAT to only 5% for hospitality, hotel and holiday accommodation and admission to certain attractions. The first increase in VAT from this source was 7.5% at the end of September 2021, which appeared in the October 2021 inflation figures. The next increase of 7.5% is scheduled for the end of March 2022 which will show up in the April 2022 inflation headline. Using the relevant CPI weights, if all the increase were to be passed on, the impact on headline inflation could be over 0.5%. However, in September the impact appears to have been extremely modest resulting in a contribution of only 0.1%. The retailers absorbed most of the increase. However, there is a risk that the increase will feed through with a lag, for example, when price lists are changed. In our forecast, we assume that the impact will be higher in April 2022 at 0.3%.
OFGEM. The increase in the energy price-cap from the end of September 2021 showed up in the October inflation figures. There will be another increase to the price-cap in April 2022. Given the increase announced earlier this month, we would predict an increase of 0.6-0.7%. However, the impact on the official figures will
[1] This analysis makes the approximation that the annual inflation rate equals the sum of the twelve month-on-month inflation rates. This approximation ignores “compounding” and is only valid when the inflation rates are low. At current levels of inflation, the approximation works well, being accurate to within one decimal place of percentage annual inflation.
- depend on exactly how the ONS will treat this change, which they will announce next month. With the recent behaviour of energy prices there also seems likely to be a big increase in the price cap at the end of September 2022 which will show up in the October 2022 inflation figures. We have set this at 0.7%.
The high level of inflation recorded in February has shifted up our forecast of inflation form last month. The patterns of the medium and high projections are similar, with a peak in April 2022 of 6.6% in the medium scenario and 6.8% in the high. After the April peak, inflation heads down and by November 2022 drops to 4.0% in the medium scenario and 4.5% in the high scenario. This means that inflation will remain well above the Bank of England’s target of 2% for some time to come even if underlying inflation remains at its historic average as in the medium scenario.
In the very high inflation scenario, inflation heads up to almost 7.2% by July 2022 and remains about 7% into 2023. In the sanctions scenario, we see inflation peaking at over 9% in January 2023 and likely to remain there for some time.
Figure 2: Looking forward to February 2023.

For further analysis of current and future prospects for inflation in the UK see:
Will Inflation take off in the UK? The Economics Observatory.
https://www.niesr.ac.uk/publications/powering-down-not-levelling-up?type=uk-economic-outlook
Related Blog Posts


Related Projects


Related News


Why it’s not worth worrying that the UK has technically entered a recession
26 Feb 2024
4 min read

1.2 million UK Households Insolvent This Year as a Direct Result of Higher Mortgage Repayments
22 Jun 2023
2 min read

The Key Steps to Ensuring Normal Service is Quickly Resumed in the Economy
13 Feb 2023
4 min read
Related Publications

Recessionary Pressures Receding in the Rearview Mirror as UK Economy Gains Momentum
12 Apr 2024
GDP Trackers
Related events

Summer 2023 Economic Forum

Spring 2023 Economic Forum

Winter 2023 Economic Forum

Autumn 2022 Economic Forum

Summer 2022 Economic Forum

Spring 2022 Economic Forum

Winter 2022 Economic Forum
