The Lockdown Weighted Inflation (CPILW) For February 2021
Summary
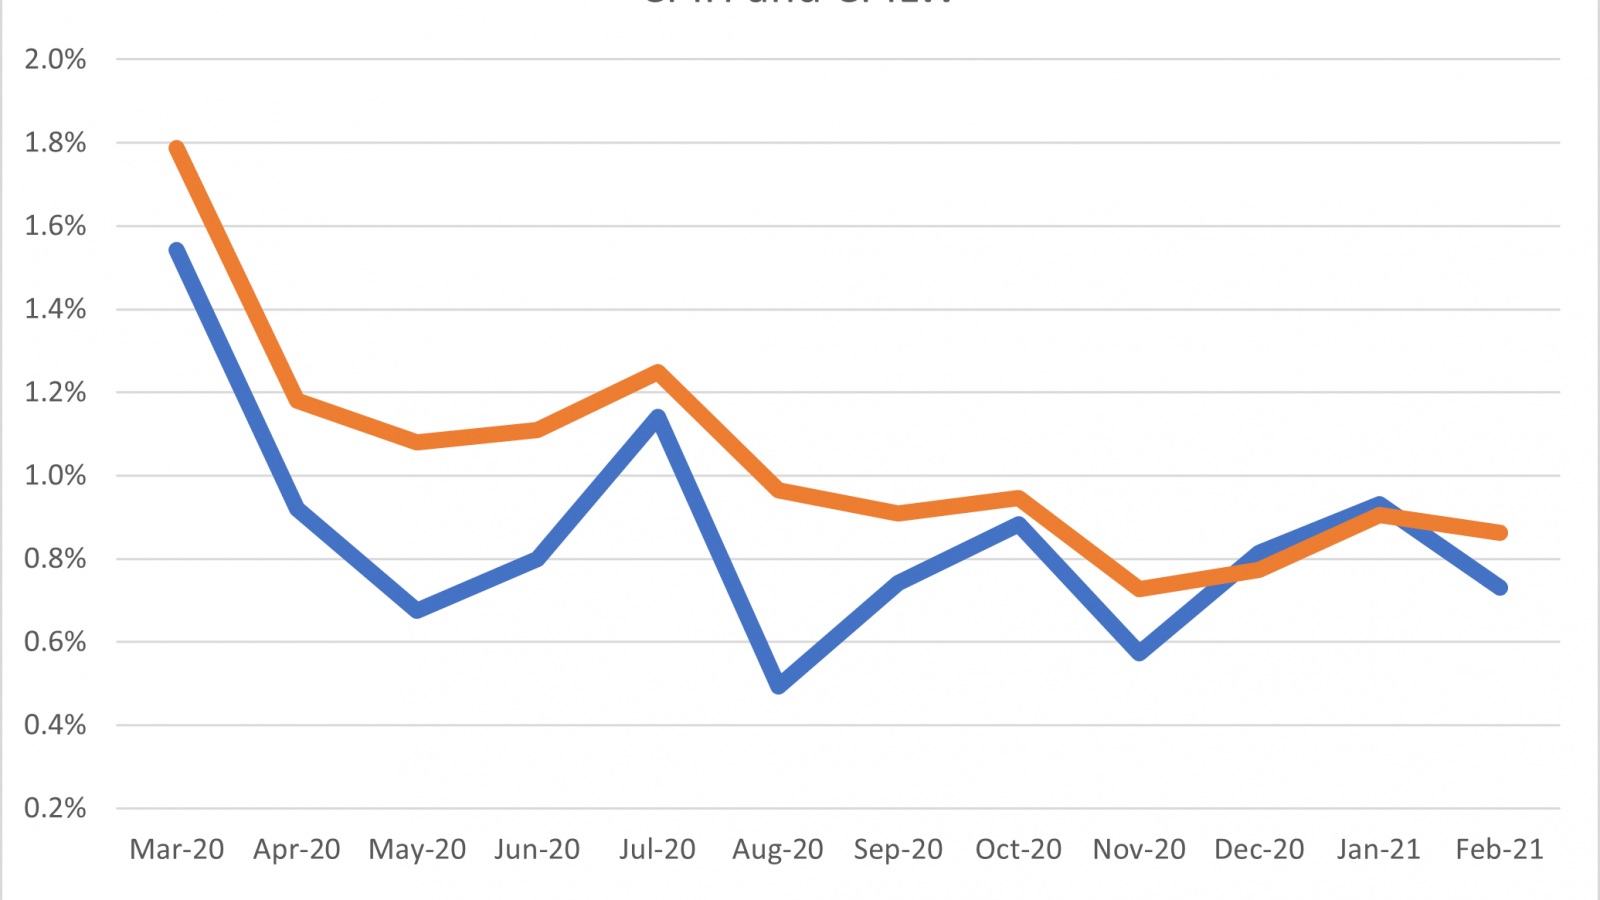
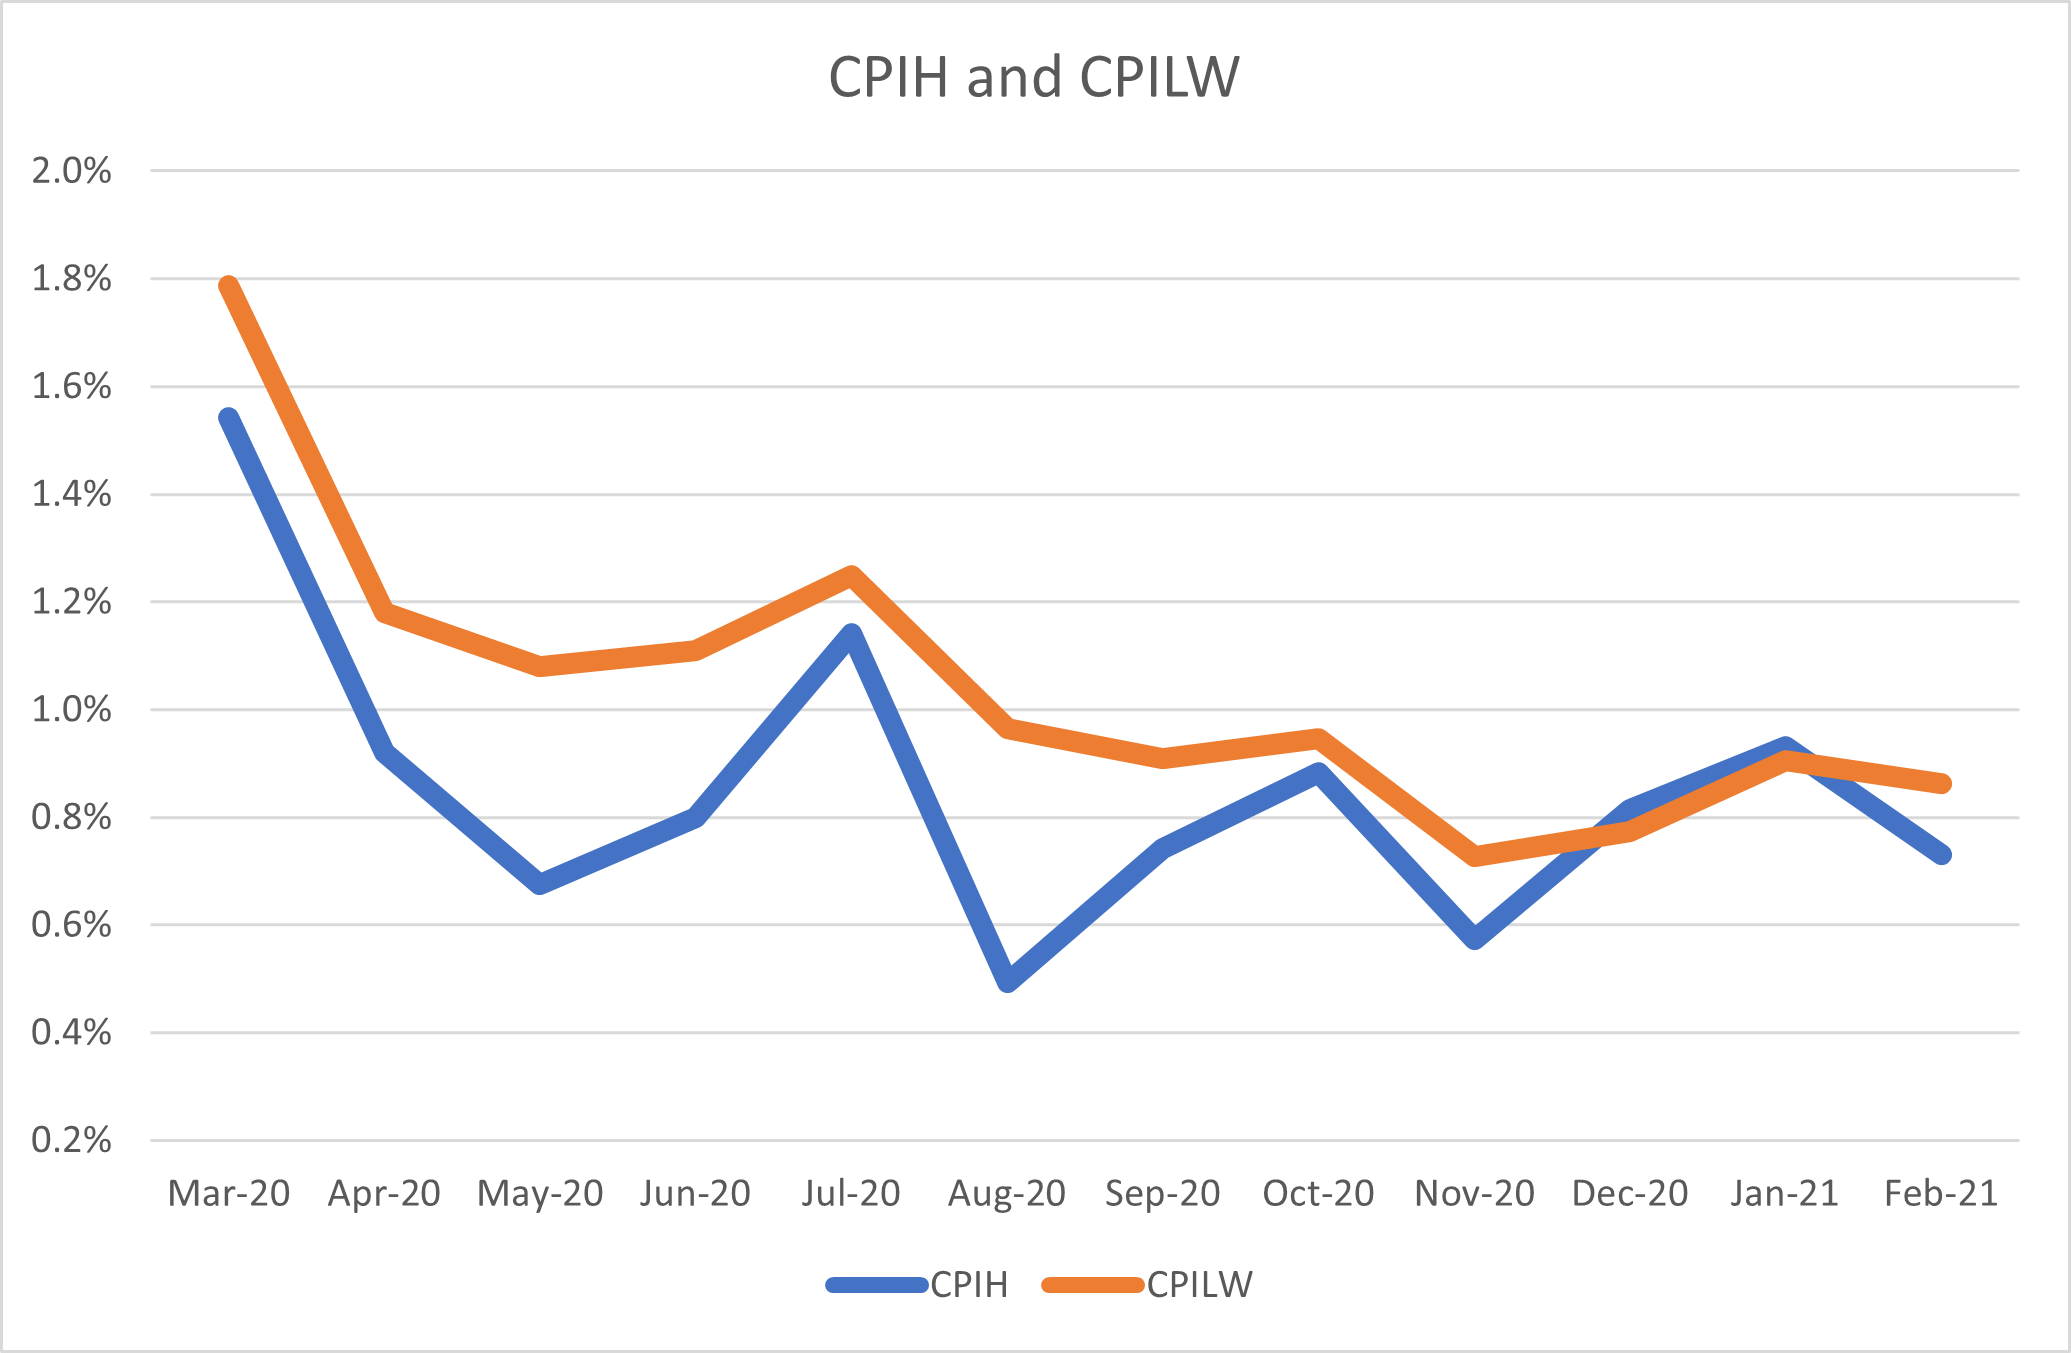
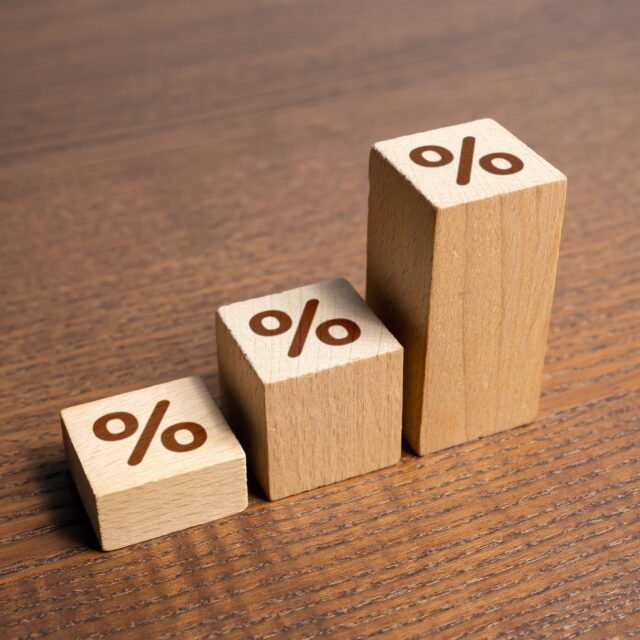
The CPILW inflation remained at 0.9% for February, unchanged from January. The CPIH measure of inflation fell slightly from 0.9% in January to 0.7% in February. Whilst the headline CPILW inflation was constant to the first decimal place, to two decimal places there was also a slight decrease from 0.91% to 0.86%.
Authors
Summary
The CPILW inflation remained at 0.9% for February, unchanged from January. The CPIH measure of inflation fell slightly from 0.9% in January to 0.7% in February. Whilst the headline CPILW inflation was constant to the first decimal place, to two decimal places there was also a slight decrease from 0.91% to 0.86%.
The gap between the official measure and the measure using lockdown weights has become negative again, being -0.13%, after being positive for the previous two months. For the months prior to December 2020 the gap between two inflation measures was always negative, with CPIH falling below CPIW.
Main Text
The CPILW inflation remained at 0.9% for February, unchanged from January. The CPIH measure of inflation fell slightly from 0.9% in January to 0.7% in February. Whilst the headline CPILW was constant to the first decimal place, to two decimal places there was also a slight decrease from 0.91% to 0.86%. Both measures indicate a slight decrease in inflation in January. Month on month inflation for both measures remains modest (0.11% for CPILW and 0.14% for CPIH).
The gap between the official measure and the measure using lockdown weights has become negative again, being -0.13%, after being positive for the previous two months. For the months prior to December 2020 the gap was always negative, with CPIH inflation falling below CPILW inflation. However, the gap has remained small (less than 0.2%) since September 2020, indicating that the official inflation figures are not significantly mis-measuring inflation due to the weights used. The main gaps were in April to June (the first lockdown and easing) and August when Eat Out to Help Out had a major downward impact on the official figures.
If we look at the change in headline CPIH inflation between January and February, we can see that there are substantial annual decreases in two COICOP divisions: Food and Non-alcoholic beverages (-1.5%), and Clothing and Footwear (-5.6%). The annual decreases reflect what has been happening over the last year, and if we instead look at the month on month figures we can see that whilst Clothing and Footwear also showed a big decrease of -1.5%, Food and Non-alcoholic beverages increased slightly by 0.3%. Two other sectors contributed to the fall in inflation, not because their inflation was low, but simply because they fell (Restaurants and Hotels from 1.1% to 0.9% and Recreation and Culture from 2.5% to 2.1%). The main sector driving inflation up was Housing, which has a very large weight in CPIH and saw an increase in its annual inflation from 0.6% to 0.8%, and to a lesser extent Transport which saw its annual inflation increase from 2.3% to 2.6%. Overall, the downward pressure on inflation dominated and the headline figure fell from 0.9% to 0.7% (the fall to two decimal places was exactly the same magnitude, from 0.93% to 0.73%).
Turning to CPILW, these changes are weighted differently – in particular, Restaurants and Hotels, Transport, and Clothing and Footwear have a smaller weight, whilst Housing and Food and Non-Alcoholic Beverages have a higher weight. The overall fall in CPILW was less: whilst it remained constant at the headline level of one decimal place at 0.9%, there was a very slight fall of 0.05% inflation from 0.91% to 0.86%. The smaller fall resulted in less weight being given to the downward pressures from Clothing and Footwear, Restaurants and Hotels, and Recreation and Culture. A larger weight was given to the upward pressures of Housing. Overall, the balance of upward and downward pressures was more evenly matched in CPILW so that the headline remained unchanged.
For both measures, the month-on-month rate implies an annualized rate below the 2% Bank of England target for CPI.
If we look at the overall price-level as measured by the index, the price level for CPIH was the highest ever in February 2021, just pipping its December 2020 level at the post after a fall in January 2021. For CPILW the February price index is at an all-time high, comfortably exceeding its previous peaks of July and September 2020.

From April -December 2020, the CPIH inflation figures were constructed using the new methodology outlined ONS 2020 for dealing with the effects of the coronavirus. As discussed in Dixon NIESR Blog 8th May, this fails to adequately take into account the changes in expenditure shares during the Lockdown. Dixon (NIESR policy paper 16, April 22nd 2020) proposed a trial statistic CPILW to measure inflation using guesstimates of the Lockdown expenditure weights. In January, the ONS has changed the expenditure weights to the estimated expenditure shares for 2020 (from the national accounts data). The methodology and detailed reasoning can be found in ONS Feb 2021.
January was the month when there was a “changing of the weights”. From January 2021 the CPIH is weighted using the estimated expenditure weights for the whole of 2020. This marks a shift from the usual practice of using the data from two years ago (which would have meant using 2019 expenditure weights), reflecting the ONS’ desire to more accurately reflect the ongoing impact of the pandemic on expenditure. The difference between the Lockdown weights and the official weights is less than in the previous year. However, the new weights are only employed in the constructing the CPIH index from January onwards and the level of the index only begins to change according to the new weights from January onwards (this is due to CPI and CPIH being a chain linked series). The new weights will begin to have a greater impact on the ONS inflation figures as the year progresses, whereas CPILW is employing the same weights for the whole period.
Changing expenditure shares can increase or decrease measured inflation, depending on how the different inflation rates for each type of expenditure behave. As time passes, we will see better measures to capture how expenditure is changing with the pandemic and this will help us to interpret the official inflation figures.
Further Reading:
ONS Corona Virus and the effect on UK Prices. May 5th 2020. https://www.ons.gov.uk/economy/inflationandpriceindices/articles/coronavirusandtheeffectsonukprices/2020-05-06)
Huw Dixon, How can we measure consumer price inflation in a lockdown? Economics Observatory (May 25th 2020).
ONS. Re-weighted consumer prices basket – adjusting for consumption changes during lockdown: July 2020. (August 19th 2020)
ONS. Coronavirus (COVID-19) and Consumer Price Inflation weights and prices: 2021 (11 February 2021).
Related Blog Posts


Related Projects


Related News
Call for Papers: Lessons From Quantitative Easing & Quantitative Tightening
09 Feb 2024
1 min read

Related Publications
Inflation Differentials Among European Monetary Union Countries: An Empirical Evaluation With Structural Breaks
20 Nov 2023
National Institute Economic Review
The Macroeconomic Effects of Re-applying the EU Fiscal Rules
20 Nov 2023
National Institute Economic Review
Another Look at a Sensible Fiscal Policy for the Sharp Rise in Government Debt
20 Nov 2023
National Institute Economic Review
Monetary Policy: Prices versus Quantities
20 Nov 2023
National Institute Economic Review
Related events
Assessing Cycles and Structural Changes in Markets
Business Conditions Forum