The Lockdown Weighted Inflation (CPILW) For March 2021
Summary
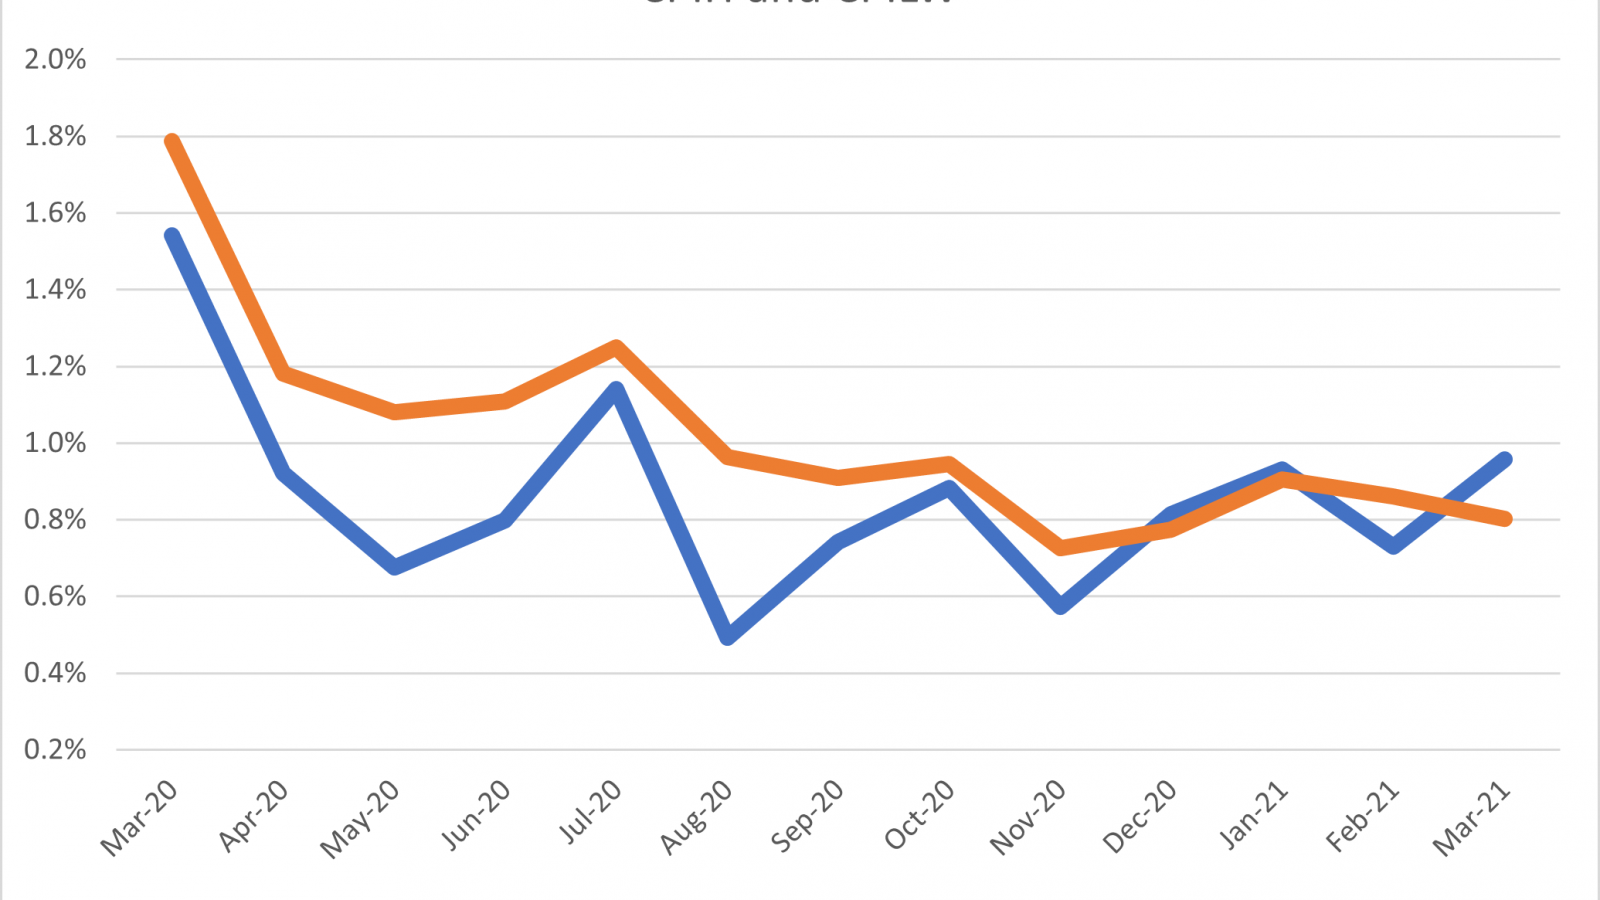
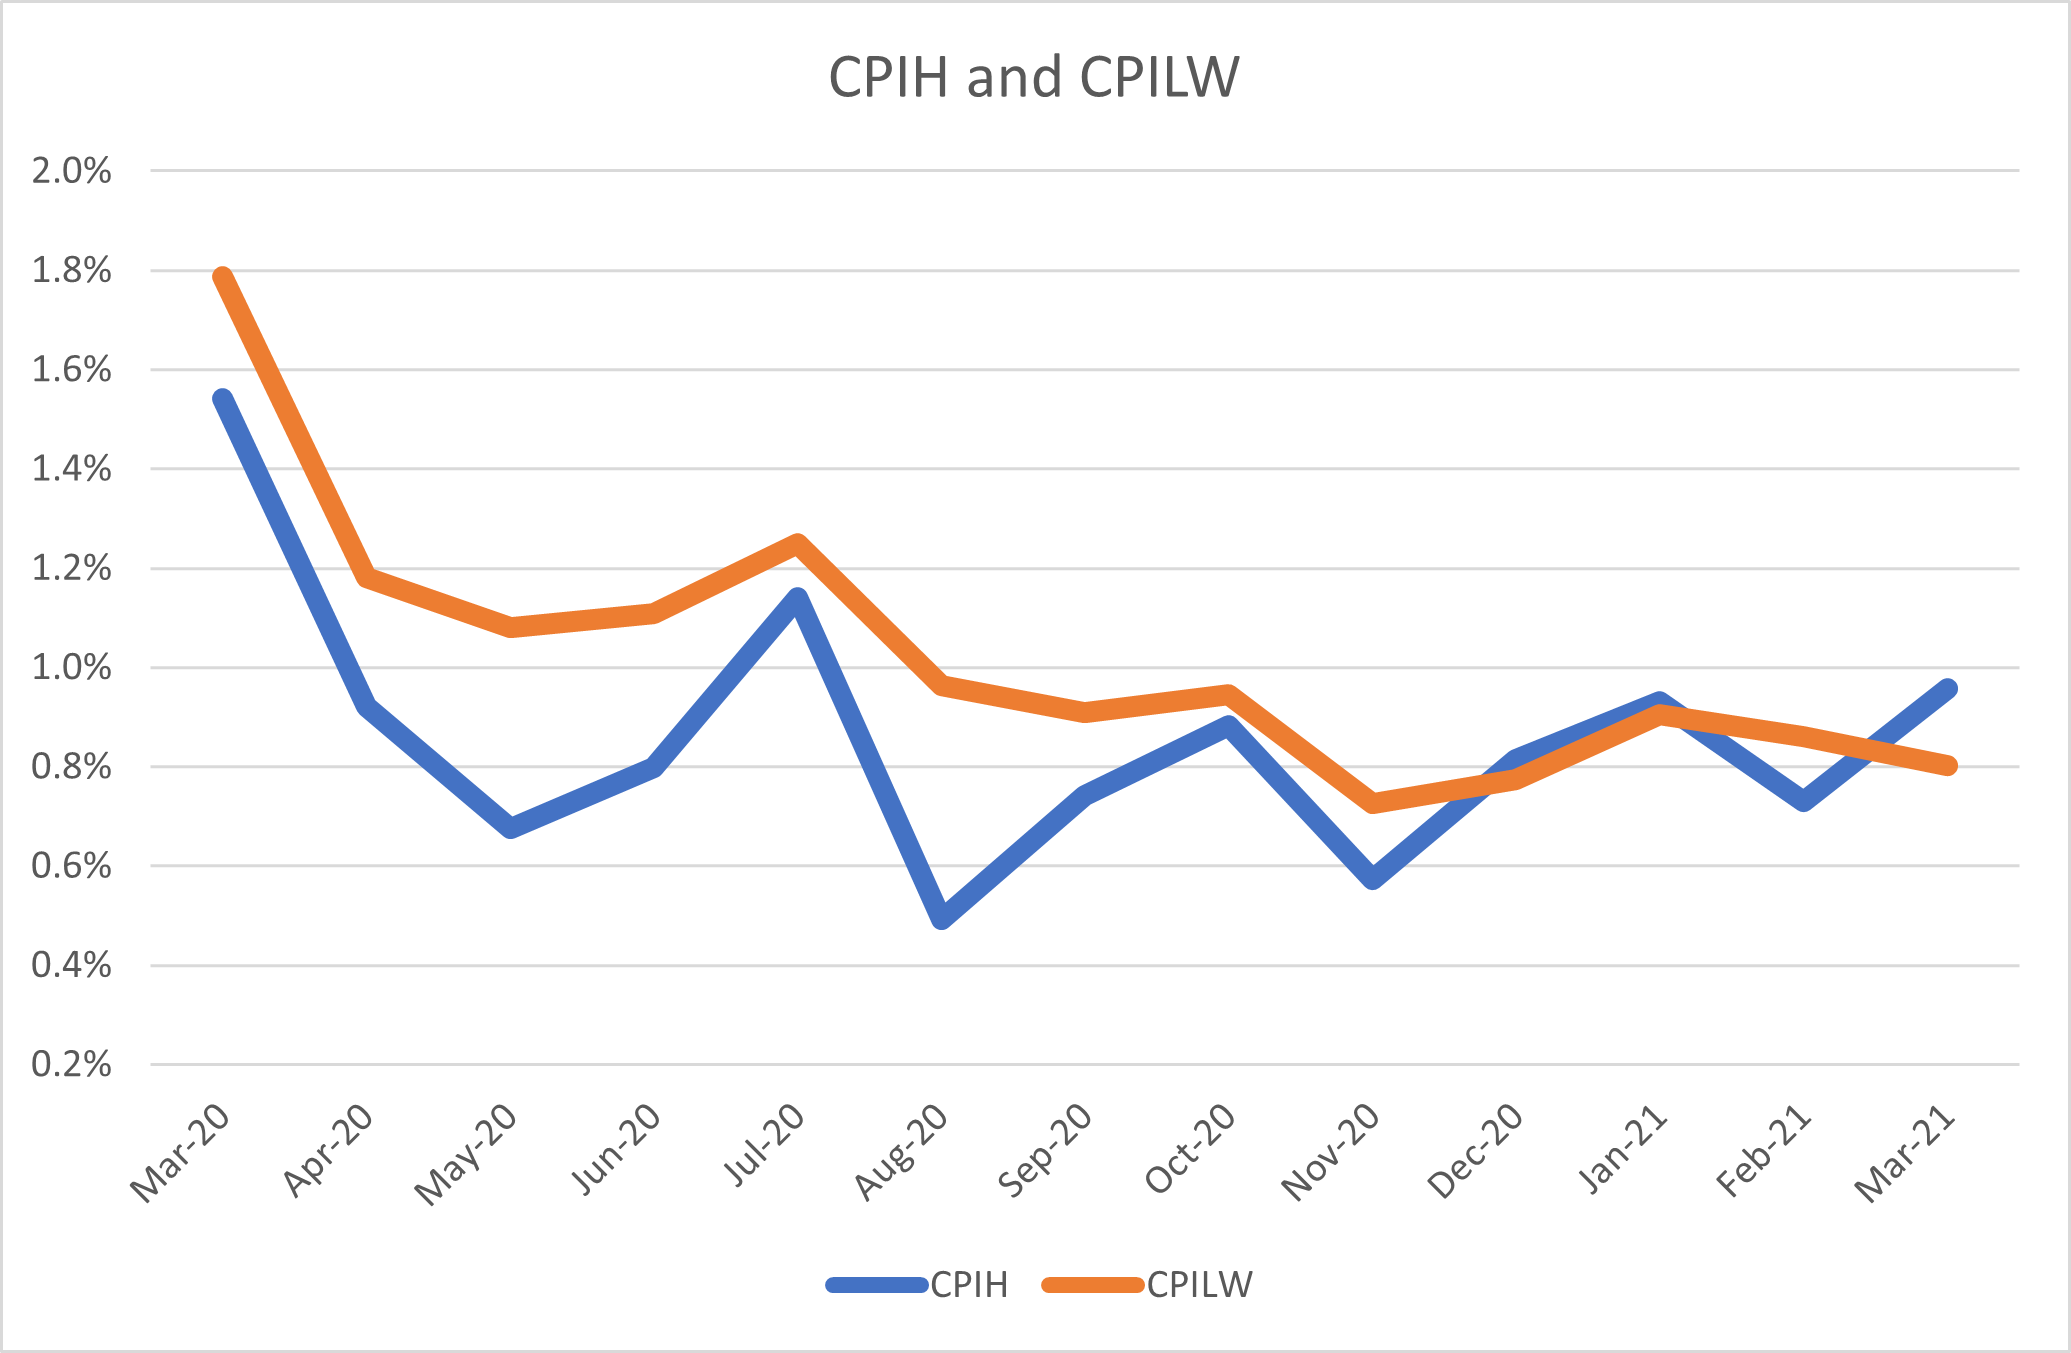
CPILW fell to 0.8% in March from 0.9% in February. The official CPIH measure of inflation rose significantly to 1% from 0.7% the previous month. The increase in inflation captured by CPIH may therefore be misleading, as it puts too large a weight on those sectors driving the increase.
Authors
Summary
CPILW fell to 0.8% in March from 0.9% in February. The official CPIH measure of inflation rose significantly to 1% from 0.7% the previous month. The increase in inflation captured by CPIH may therefore be misleading, as it puts too large a weight on those sectors driving the increase.
The gap between the official measure and the measure using lockdown weights has switched from negative to positive again, being 0.15%, after being negative for the previous two months. For the months prior to December 2020 the gap was always negative, with CPIH being less than CPILW, indicating that the official measure has tended to understate inflation during most of the pandemic.
Main Text
The CPILW remained fell to 0.8% from 0.9% in February. The CPIH measure of inflation rose significantly to 1% from 0.7% in February. The increase in inflation captured by CPIH may therefore be misleading, as it puts too large a weight on those sectors driving the increase.
The fall in CPILW was this month exaggerated by rounding: the more precise figure to two decimal places fell from 0.86% in February to 0.8% in March, a fall of only 0.06pp. In contrast, rounding raised the increase for CPIH: to two decimal places it rose by 0.23pp from 0.73% to 0.96%. Whilst month on month inflation for CPIH was high at 0.23%, for CPILW there was only a very slight increase of 0.04%.
The gap between the official measure and the measure using lockdown weights has become positive, with CPIH exceeding CPILW. Furthermore, they are moving in the opposite direction. To understand this divergence, we need to look a bit more closely at what is behind the figures.
To understand the different behaviour of CPILW and CPIH this month, we need to look at the main sectors driving the changes. If we look at the COICOP divisions, there were some big increases in Transport (up 1.3pp to 3.9%) and Furniture, Household Equipment and Maintenance (up 0.7pp to 1.5%). Also, although Clothing and Footwear was falling, there was an increase of 1.8pp to -3.8%, since the fall was even bigger in February at -5.6%. Now, these three sectors are all ones with a significantly lower weight in CPILW than in CPIH. Whilst driving CPIH up significantly, they left CPLIW only slightly different. There were falls in the inflation rate for Health, Alcohol and Tobacco, and Communication. Perhaps CPILW exaggerates the fall in expenditure shares of Transport and Clothing and Footwear, being an estimate based on the first lockdown where online shopping was not that prevalent and click and collect services were not available
There has been much talk in the press in recent weeks about “base effects” coming into play in annual percentage changes such as headline CPIH and annual GDP growth. This does not affect the March inflation figures, as the CPI price-quote data being use for March 2020 were collected in the first two weeks of March. Whilst there was some pandemic effect in early March, it did not really hit until the second half. The annual CPIH figure is essentially the sum of the twelve month-on-month (mom) inflation rates. As we move from the February to the March 2021 figure, the March 2020 mom “drops out” and the March 2021 mom “drops in”, and the overall change in headline inflation is simply the difference between the two. In this case, the March 2020 mom was almost zero (0.01%) whilst March 2021 is 0.23%, giving rise to the 0.23pp increase in the headline CPIH (which with rounding becomes 0.3pp).
As we move forward into April onwards, there are some large mom inflation figures which will drop out: notably July (0.38%), August (-0.32%) and September (0.35%). The August and September figures reflect the Eat out to Help Out initiative and its reversal. The Inflation figures for July to September 2021 should be particularly variable due to this historic echo effect in the headline inflation figures. The other big mom figure in 2020 was December (at 0.24%). However, since the “normal” mom rate corresponding to annual inflation around the long-run average of 2% is 0.17%, we can expect CPIH to rise in 2021 as in most of the months during the pandemic mom was significantly less than this (and even negative in some months). However, for inflation to rise above 2% we would need a succession of mom figures above 0.17% in 2021.
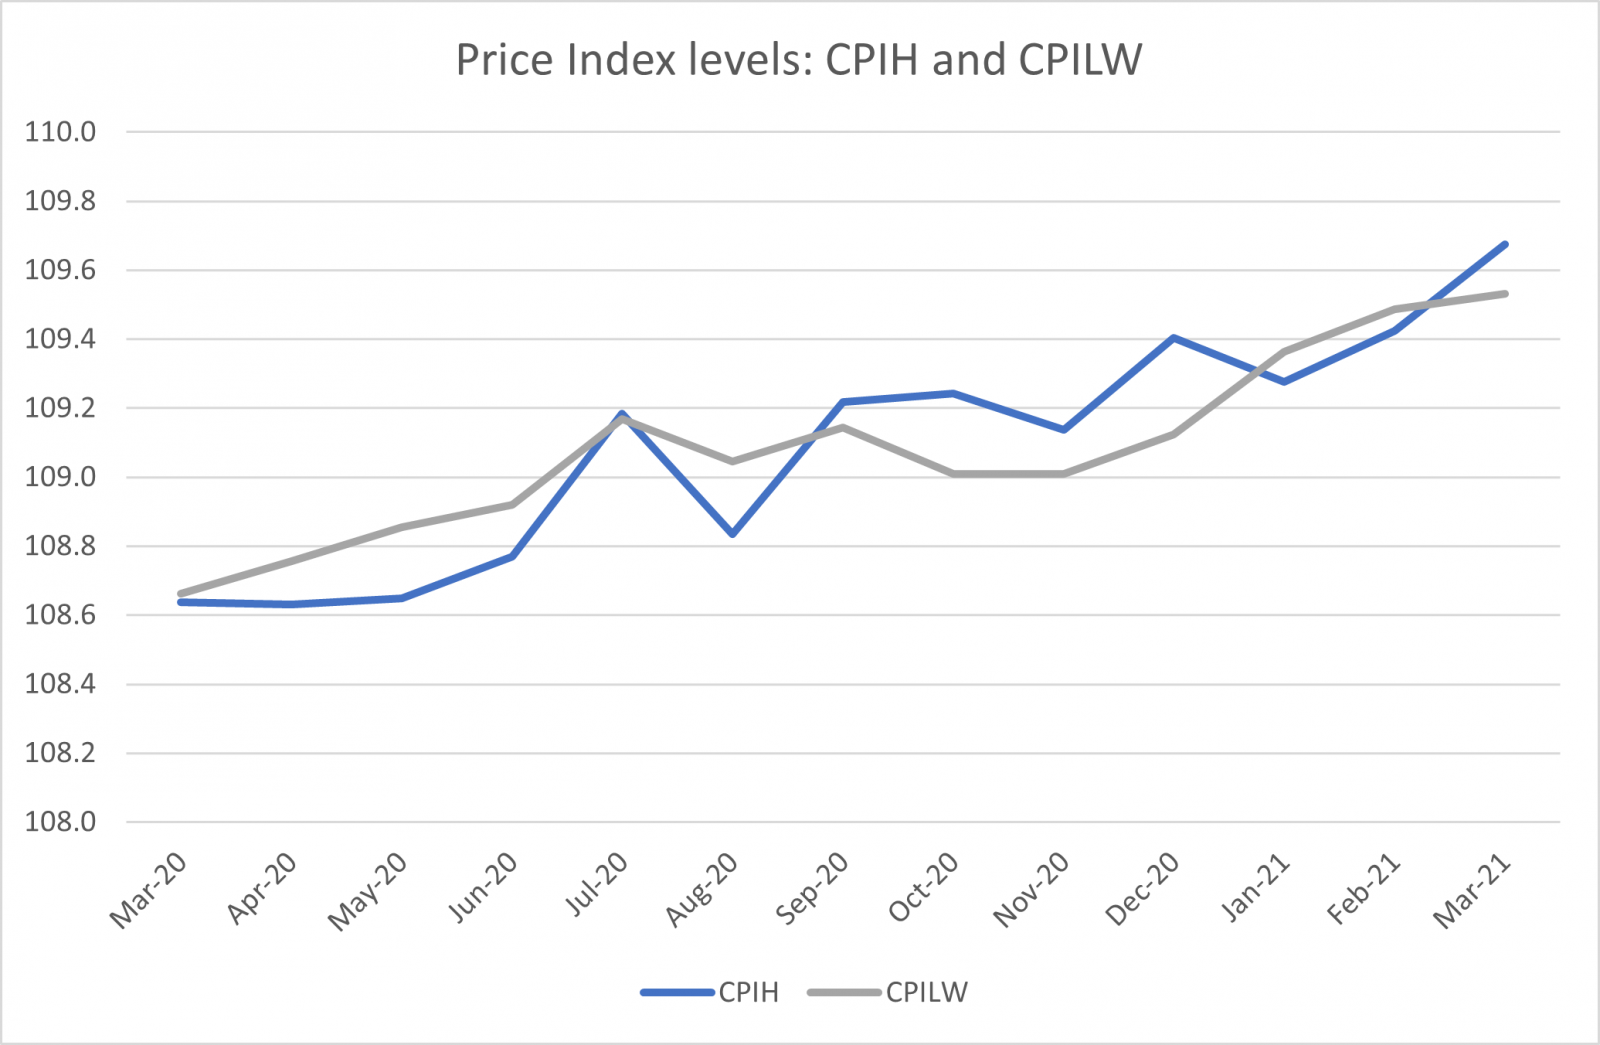
If we look at the overall price-level as measured by the two measures CPIH and CPILW, we can see that CPILW is below CPIH. Their paths have diverged with CPILW above CPIH levels April to June, and below for September to December, being close in the other months.
Further Reading:
ONS Corona Virus and the effect on UK Prices. May 5th 2020. https://www.ons.gov.uk/economy/inflationandpriceindices/articles/coronavirusandtheeffectsonukprices/2020-05-06)
Huw Dixon, How can we measure consumer price inflation in a lockdown? Economics Observatory (May 25th 2020).
ONS. Re-weighted consumer prices basket – adjusting for consumption changes during lockdown: July 2020. (August 19th 2020)
ONS. Coronavirus (COVID-19) and Consumer Price Inflation weights and prices: 2021 (11 February 2021).
Related Blog Posts


Related Projects


Related News

Call for Papers: Lessons From Quantitative Easing & Quantitative Tightening
09 Feb 2024
1 min read

Related Publications

Inflation Differentials Among European Monetary Union Countries: An Empirical Evaluation With Structural Breaks
20 Nov 2023
National Institute Economic Review

The Macroeconomic Effects of Re-applying the EU Fiscal Rules
20 Nov 2023
National Institute Economic Review

Another Look at a Sensible Fiscal Policy for the Sharp Rise in Government Debt
20 Nov 2023
National Institute Economic Review
Monetary Policy: Prices versus Quantities
20 Nov 2023
National Institute Economic Review
Related events
Assessing Cycles and Structural Changes in Markets

Business Conditions Forum