Low Growth is the “New Normal” for the UK and Other Western Economies
The Coronavirus pandemic has cast a dark cloud over UK economic prospects for the 2020s. The latest NIESR forecast suggests that GDP will not return to its 2019 level until 2023 or 2024. The Bank of England is more optimistic about the potential for the UK economy to bounce back but it is still not expecting the 2019 level of GDP to be exceeded until 2022. The Office for Budget Responsibility (OBR) central scenario is for a recovery somewhere between the NIESR and Bank projections.

Authors
The Coronavirus pandemic has cast a dark cloud over UK economic prospects for the 2020s. The latest NIESR forecast suggests that GDP will not return to its 2019 level until 2023 or 2024. The Bank of England is more optimistic about the potential for the UK economy to bounce back but it is still not expecting the 2019 level of GDP to be exceeded until 2022. The Office for Budget Responsibility (OBR) central scenario is for a recovery somewhere between the NIESR and Bank projections.
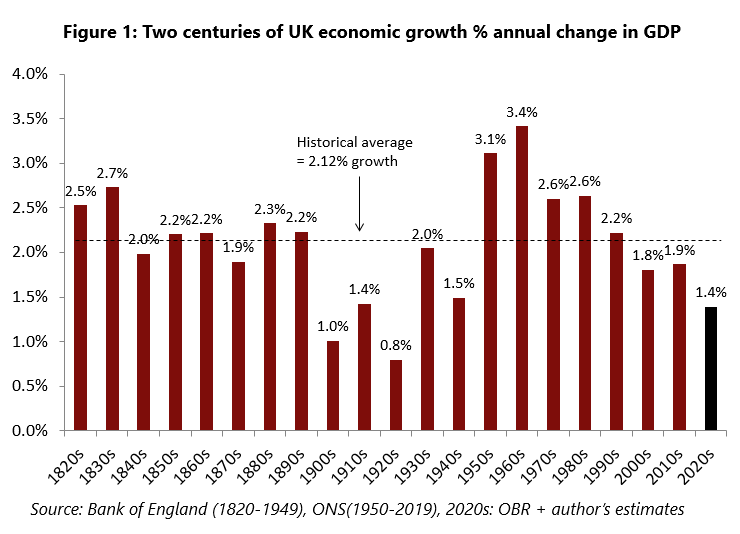
What does this mean for longer-term economic growth prospects? Using the OBR forecast – and then assuming that UK economic growth returns to its longer term trend of just over 2 percent in the second half of this decade – would still only produce a growth rate of 1.4 percent across the 2020s as a whole. And it would be significantly lower than the historical average since the 1820s of 2.12 percent. So, as the chart above shows, we seem to be heading towards the weakest decade of UK economic growth for a hundred years.
This should not necessarily come as a big surprise, however. Since the 1950s and 1960s, when GDP growth averaged over 3 percent, UK economic growth has been progressively slowing decade by decade. The first two decades of this century saw economic growth averaging below 2 percent and the 2020s look set to be even weaker.
The pattern of a slowing longer-term growth trend is not confined to the UK. Across the G7 economies, GDP growth averaged 2.7 percent in the 1980s and 1990s and has dropped to 1.7 percent in the 2000s and 2010s. Relative to the G7, the UK economy has performed better than the average in the twenty-first century so far. We are not looking for a UK-specific explanation of slower growth – rather something which applies to a wider range of economies.
The prevailing explanation which has emerged for disappointing economic growth and slow productivity growth is the “chapter of accidents” view. The first major accident was the 2007-9 financial crisis and the second accident was Brexit. This is the explanation offered by Nick Crafts and Terence Mills in their article in the NIESR Economic Review earlier this year. In addition, they argue that computer-based productivity growth has slowed down – though that is somewhat counter-intuitive given the pace of IT development in smartphones and other applications. As the Nobel-prize winning economist Bob Solow famously commented in the 1990s: “You can see technology everywhere except in the productivity figures”.
In any case, these ideas do not explain the sustained growth slowdown we have seen in the UK since the 50s and 60s. If UK economic growth has been slowing for 50-60 years, we need an explanation based on longer-term economic trends, not temporary economic shocks.
In my view, economic growth and productivity growth trends in the UK and across the Western World can be explained by two main influences.
The first is the gradual shift to a more services-oriented economy. William Baumol, who died only a few years ago, had the great insight that that services activities – which rely on personal service and face-to face delivery – have much less potential for productivity growth than manufacturing.
At the peak of the UK’s post-war growth cycle, in the 1960s, around a third of output and employment was devoted to manufacturing. The proportions are now less than 10 percent.
The second influence is long waves in technology supported by strong investment, increased trading opportunities and political stability. Since the Second World War, we have seen two such long waves. The first was the post-war recovery period from the 1950s which continued until the mid-1970s. That was supported by the release of spending power after WW2, the civilian application of many wartime technologies, open trade agreements (GATT, EEC, etc.) and a prolonged period of relative economic and political stability.
After the turmoil of the 1970s and the 1980s, a new long wave developed – which ran from the early 1980s until the mid-2000s. The drivers this time were different from the 50s and 60s – information technology, financial liberalisation and globalisation – with China, Russia and Eastern Europe integrating into the world economy.
It would be optimistic to think we are now on the threshold of the third post-war growth wave. In the current climate it is difficult to see where it might be coming from, though investment in green technologies and the low carbon economy offers some opportunities. But there are many other negative influences, including the rising protectionist threat from US-China trade conflicts.
So batten down the hatches – and prepare for a rather disappointing decade of UK economic growth in the 2020s. Maybe the 2030s will be better.
By NIESR Visitor Andrew Sentance, Senior Adviser at Cambridge Econometrics and former MPC member.
Related Blog Posts


Related Projects


Related News


Related Publications


Productivity and Investment: Time to Manage the Project of Renewal
12 Mar 2024
UK Productivity Commission
UK Households Should Start Feeling Better Off as Election Looms
07 Feb 2024
UK Economic Outlook
Low to Middle Income Households Facing Seven Years of Falling Living Standards
08 Nov 2023
UK Economic Outlook
Related events

Investing for Growth: boosting productivity through higher public and private investment

The Outlook for the Welsh Economy

Prais Lecture with Chris Pissarides: The Future of Work and Wellbeing
A View and Prospects for British Investment

How Can We Raise Investment?

Productivity Commission Evidence Session: Examining the Role of International Investment

High Dimensional Forecasting and its Pitfalls – M. Hashem Pesaran