Monday’s Macro Memo: Is Unemployment Too Low?
GDP increases over time for two reasons. First, the economy produces more output because we use more labour and more capital. Second, the economy produces more output because we use better techniques over time. Traveling from London to Glasgow on a high-speed train is much faster than travelling there in a horse-drawn carriage. An increase in GDP for this second reason is called productivity growth.
Authors
GDP increases over time for two reasons. First, the economy produces more output because we use more labour and more capital. Second, the economy produces more output because we use better techniques over time. Traveling from London to Glasgow on a high-speed train is much faster than travelling there in a horse-drawn carriage. An increase in GDP for this second reason is called productivity growth.
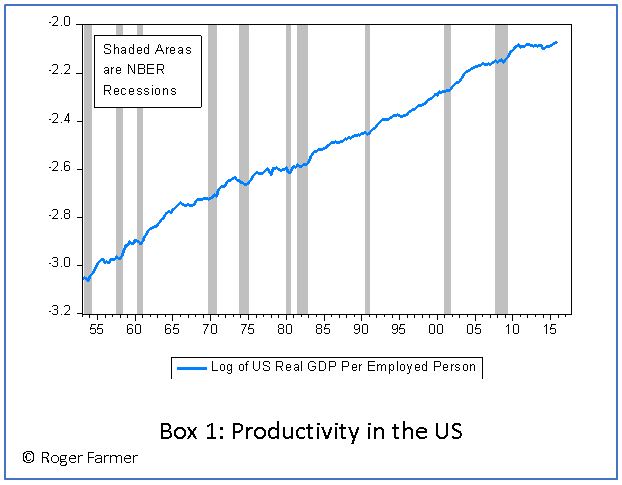
Productivity has been growing at a rate of roughly 1.7% per year since the beginning of the industrial revolution. In the absence of productivity growth, we would have the same standard of living as our grandparents. When productivity grows at 1.7%, our standard of living doubles every forty years or so. I have graphed US productivity in Box 1.
But although productivity grows on average; it does not grow the same amount every month. Some months are periods when GDP per person grows faster than normal. Other months, are periods when GDP per person grows slower than normal. In the 1980s, macroeconomists of the real business cycle (RBC) school convinced the profession that these random fluctuations in productivity growth, above or below trend growth, are the main cause of recessions.
In the period from 1953 to 1980, productivity and employment moved in the same direction in the US data. When productivity was high, so was employment. That fact supported the RBC theory. But since 1980, this stylized fact has reversed. In more recent data, high productivity goes hand in hand with low employment. How can we explain this reversal?
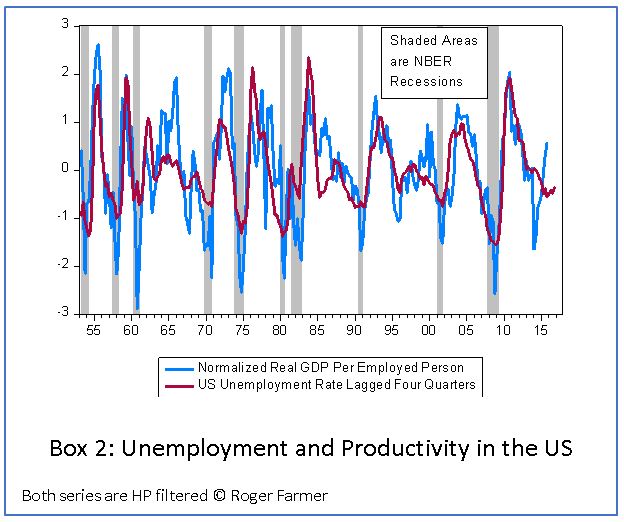
In Box 2 I plot a graph of US labour productivity (in blue) and the unemployment rate (in red). Both series are expressed as deviations from a flexible trend and the unemployment rate is lagged by four quarters. This figure shows that, when unemployment is low, productivity will be below trend one year later. I will refer to this as the productivity-unemployment puzzle because macroeconomists have operated on the assumption that productivity and employment move in the same direction. That should imply that productivity and unemployment move in opposite directions. The figure shows that, on the contrary, productivity and unemployment move in the same direction once we account for time-lags. The correlation between unemployment in year t, and productivity in year t+1, is strongly positive and has remained stable in the entire post-war period. How can we explain that fact?
 In my book Prosperity for All, I provide an explanation for the positive correlation between productivity and unemployment. When demand is low, firms employ fewer workers and there are more unemployed people searching for jobs. Firms find it easier to fill vacant positions and their overhead costs for recruitment fall. That fall in recruiting costs shows up as higher productivity. I am open to other possible explanations and I invite you to think about how this correlation might be credibly explained.
The unemployment-productivity puzzle is not confined to the US. Last week, Amit Kara and Ana Rincon-Aznar, two of my colleagues at NIESR, published a blog on the connection between total factor productivity (TFP) and employment in the UK.* That blog featured the graph in Box 3 that plots total factor productivity on the y-axis against employment on the x-axis. Here is what Amit and Ana said about this graph in their post.
.JPG)
“We find … a long-standing trade-off between employment and productivity such that periods of high productivity are associated with low employment and vice versa. … TFP is thought to capture technological change and efficiency gains and is generally considered to be independent of an increase in the quantity and quality of labour and capital inputs.”
The productivity-unemployment puzzle presents a dilemma for policy makers. If the theory I describe in Prosperity for All is the right explanation for these data, then very low unemployment is as bad for the economy as very high unemployment. This graph suggests an intriguing question: Is unemployment too low? Very low unemployment is achieved by diverting resources from the activity of producing goods, to the activity of filling vacant jobs. Perhaps the UK has moved too far in the pursuit of full employment.
__________________
*Productivity is measured in two ways. Labour productivity is the ratio of GDP to employment. Total Factor Productivity or TFP, is a more sophisticated measure that takes account of the input not only of labour, but also of capital. For the most part, these measures move closely together.
Related Blog Posts


What Are the Implications of the Rising National Minimum Wage and National Living Wage Rates?
19 Mar 2024
5 min read


Related Projects


Related News

Press Release: Compositional effects push up average weekly earnings at the end of 2020
26 Jan 2021
2 min read
Press Release: 2020 shaping up to be the worst year for total pay growth since 2009
15 Dec 2020
2 min read
Related Publications

Pay-Setting Among Employers in the Agriculture, Cleaning, Hospitality and Retail Sectors
11 Mar 2024
Research Report

Job Boom or Job Bust? The Effect of the Pandemic on Actual and Measured Job and Employment Growth
07 Feb 2024
UK Economic Outlook Box Analysis

Kurzarbeit/Short Time Working: Experiences and Lessons from the Covid-Induced Downturn
20 Nov 2023
National Institute Economic Review

Related events
