No early pay rise for UK plc
There is a puzzle around the world as to why wage growth has been so weak given that the unemployment rate has returned to pre-recession levels. This lack of wage pressure has continued to generate consternation among policy makers, who continue to expect nominal annual wage growth to revert to pre-recession averages of 4% or higher and real wage growth nearer to 2%.

Authors
There is a puzzle around the world as to why wage growth has been so weak given that the unemployment rate has returned to pre-recession levels. This lack of wage pressure has continued to generate consternation among policy makers, who continue to expect nominal annual wage growth to revert to pre-recession averages of 4% or higher and real wage growth nearer to 2%. This has been true both of the FOMC in the United states and the MPC. For example, in the opening statement at the February 2018 press conference for the Inflation Report Bank of England Governor Carney argued:
“The firming of shorter-term measures of wage growth in recent quarters, and a range of survey indicators that suggests pay growth will rise further in response to the tightening labour market, give increasing confidence that growth in wages and unit labour costs will pick up to target-consistent rates.”
On February 21st, 2018 in a speech the Bank of England’s chief economist, Andy Haldane continued the hopeful theme that wages were set to skyrocket:
“The long-awaited — and we have been waiting for a long time — pickup in wages is starting to take root. We get intelligence from our agents that would suggest that wage settlements this year were going to pick up, perhaps to a number with a three in front of it, rather than a two in front of it.”
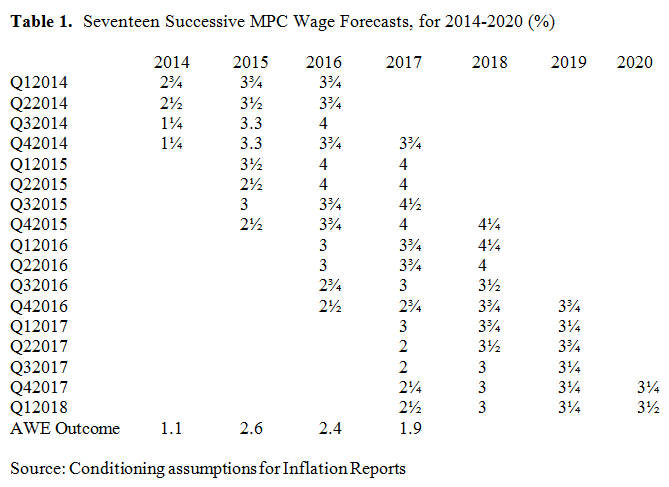
Table 1 shows the MPC’s forecast for wage growth in the last seventeen inflation reports dating from February 2014 through February 2018. Each of these forecasts over-estimated wage growth and there has been little or no learning from previous errors. The forecasts have been poor to say the least. Three-year ahead wage forecasts in every case were around 4%, but over time the forecasts were reduced as the data showed that a 2% pay norm existed. Even in February 2018, the MPC is forecasting wage growth of 3% in 2018, 3¼% in 2019 and 3½% in 2020 which seems most unlikely.
It is our contention, explored in our latest Discussion Paper for NIESR entitled ‘The Lack of Wage Growth and the Falling NAIRU’, that a considerable part of the explanation is the rise in underemployment which rose in the Great Recession but has not returned to pre-recession levels even though the unemployment rate has. Involuntary part-time employment rose in every advanced country during the Great Recession and remains elevated in many in 2018, with the main exception being Germany. In the UK, the number of workers who say they want a full-time job, expressed as a proportion of total employment is 3.2% in the latest data, versus 2.3% in March to May 2008.
In the UK, we construct the Bell/Blanchflower underemployment index which is an improvement over the involuntary part-time measure. Our index is based on reports of whether workers, including full-timers and those who want to be part-time as well as those who say they are stuck in a part-time job because they can’t find a full-time job, who say they want to increase or decrease their hours at the going wage rate. This is illustrated in Chart 1. If workers want to change their hours they report by how many, up or down, so we can calculate the number of hours desired by those who want more hours and the numbers of hours desired by those who want fewer. Prior to 2008, our underemployment rate was below the unemployment rate. We also calculate excess hours desired which can be negative or positive. Over the period 2001-2017 we find little change in the number of hours of workers who want fewer hours, but a big rise in the numbers wanting more hours. The gap has narrowed recently.
.PNG)
Chart 2 plots our calculated underemployment rate versus the unemployment rate where excess hours is translated into unemployment equivalents using average hours. Of note is that prior to the start of the Great Recession the underemployment rate was below the unemployment rate. The latest data we have for Q42017 has the underemployment rate at 4.9% versus a low of 3.8% in Q22004.
.PNG)
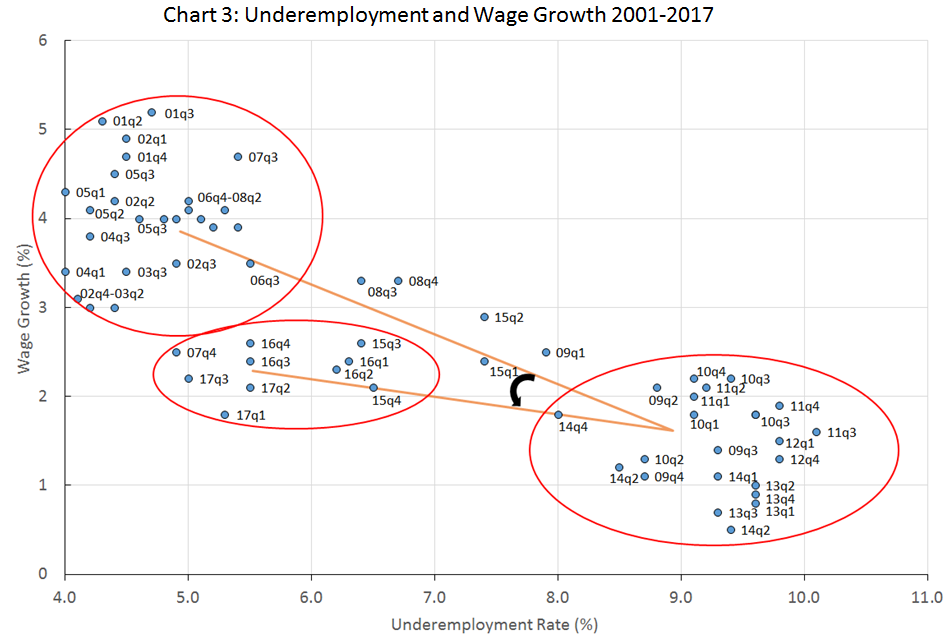
We provide evidence for the UK Labour Force Surveys that the underemployed are paid less. We also report international time series evidence that underemployment reduces wage pressure. We also provide evidence as shown in Chart 3 that the UK Phillips Curve has flattened. We argue that it makes more sense to focus on the underemployment rate rather than the unemployment rate, which understates labour market slack. Chart 3 shows three distinct sets of points covering the period prior to the Great Recession; the Recession itself and then the period from 2014 onwards – with transition paths in between. There is no evidence of any recent pick-up in wage growth.
We present additional evidence that suggest that the natural rate of unemployment, the NAIRU, can move and indeed has moved downwards recently. It seems that wage growth has fallen as productivity has fallen and employment growth has slowed. The very low wage growth rates in the last few periods have occurred when output per head was growing at less than 1% and employment growth was slowing. Low paid workers were hired. There was an industry-wide slowdown in business investment during the crisis and subdued growth since, which helps to explain the productivity slowdown.
Beveridge was surprised to find that the unemployment rate in the UK averaged 1.5% between 1948 and 1959. In 1944 he had suggested it might fall as low as 3% and Keynes surmised that that was likely too low, so both were surprised on the low side. Friedman argued that the natural rate of unemployment is not unchanging. Past Fed Chair Janet Yellen noted the possibility that the rate may be much lower than currently projected. In recent testimony current Fed Chair Jerome Powell argued that rate may be as low as 3.5%. Nobel Economics Laureate Ned Phelps recently speculated that the NAIRU had fallen because workers have been shaken by the 2008 financial crisis.
Underemployment continues to push down on wages even though the unemployment rate is low. We have also presented evidence that the UK Phillips curve has flattened and as a result the UK NAIRU has declined. At the same time, productivity growth has been flat even though employment growth has been strong. Flat productivity led to flat wage growth. Flat wage growth led to low productivity. The newly hired low wage workers had low productivity.
Improvements in the availability of information about job vacancies and labor supply, all of which have been enhanced by the internet, tend to lower the natural rate. Worker’s bargaining power has weakened with increased globalization. Labour is mobile and firms can move production almost at will and works know that. Firms can move abroad or farm out their work to consultants at home and abroad. Union bargaining power has weakened as unionization rates have fallen around the world, and especially so in the private sector. Workers care about security and flexibility. Migrant flows may have put some downward pressure on wages and greased the wheels of the labor market as their presence has increased mobility. They are free to move about the country to where the work is. There is also evidence that the decline in the home ownership rate, which slows job creation and increases unemployment, has helped mobility and helped to lower the natural rate.
The underemployment rate likely would need to fall below 3%, compared to its current rate of 4.9% before wage growth is likely to reach pre-recession levels. In the latest ONS data release on the 17th April 2018, AWE total weekly pay rose 2.3% year on year even though the unemployment rate ticked down to 4.1%. Weekly wages according to the UK’s national statistic are £513 a week which is the same rate it has been for the last three months in a row. Real weekly earnings fell on the month and are £486 in constant 2015 prices in February 2018. This compares with £487 in February 2017; £484 in February 2016 and £493 in June 2010 when the coalition was formed and £522 in February 2008 just before the start of the Great Recession, all in constant prices. Workers are 6.5% worse off in real terms today than they were a decade ago and there is no sign of much improvement.
The UK is a long way from full-employment. The combination of elevated underemployment and a flattened Phillips curve means that wage growth is not going to take off any time soon. This is not the time for a rate rise.
Related Blog Posts


Related Projects


Related News

Call for Papers: Lessons From Quantitative Easing & Quantitative Tightening
09 Feb 2024
1 min read

Related Publications

Inflation Differentials Among European Monetary Union Countries: An Empirical Evaluation With Structural Breaks
20 Nov 2023
National Institute Economic Review

The Macroeconomic Effects of Re-applying the EU Fiscal Rules
20 Nov 2023
National Institute Economic Review
Another Look at a Sensible Fiscal Policy for the Sharp Rise in Government Debt
20 Nov 2023
National Institute Economic Review
Monetary Policy: Prices versus Quantities
20 Nov 2023
National Institute Economic Review
Related events
Assessing Cycles and Structural Changes in Markets

Business Conditions Forum