No Significant Decline in Inflation Expected Before 2023
Authors
CPI rose to 9.4% in June, up from 9.1% in May. Despite a big drop out of 0.5% from June 2021 the increase in CPI inflation reflected the very high level of new inflation between May and June 2022 of 0.8%. Month on month Inflation remains well above the historic norms and we are starting to see the impact of war and sanctions on Food and Energy–consuming Transport. If new inflation continues at this high level, inflation will not drop significantly until 2023. The main contributors to the change in inflation were:
- Transport 0.16%
- Food and Non-Alcoholic Beverages 0.13%
- Restaurants and Hotels 0.12%
- Clothing and Footwear – 0.06%
Other sectors made small increases or decreases which added up to the overall increase of 0.33% from 9.08% to 9.41%. (Headline inflation increased from 9.1 to 9.4% as (the ONS publishes inflation to one decimal place.))
Whilst the large increase in inflation in April was mainly driven by domestic energy prices, Food and Transport are the main drivers keeping inflation high in May. The increase in inflation is a mixed story which reflects the base effects from the previous year’s high inflation in May-June 2021. The negative contributions to current inflation from Clothing & Footwear and Furniture & Household Equipment arise from the base effect of past increases dropping out.
This will be the story for the rest of 2022. Month on month inflation was high for most months in 2021; as we move forward, to sustain or increase the headline inflation level, new inflation will need to come forward to replace that. If the new inflation in 2022 is higher than the old inflation dropping out from 2021, we will see an increase in inflation; if the new inflation is less we will see a decrease. The inflationary story for 2022 will be a tug of war between past inflation pulling down with the new inflation pulling up.
The future path of inflation depends crucially on how the war itself affects the world economy and more importantly the impact of sanctions imposed on Russia by the Western powers. The war and sanctions are having major effects on a range of commodities, includingwheat and other grains, fertiliser, various metals and of course energy. (See my March inflation blog for more details.)
All of these commodities will be affected to some extent and the ensuing restrictions on supply will be a major driver of inflation in the UK and around the world. Currently, sanctions have been imposed by the “Western powers”, the US, Canada, the EU, the UK and their close allies in the far East (Japan, South Korea, Australia, New Zealand, Singapore and Taiwan). The impact of sanctions on the UK economy will also depend on whether secondary sanctions are imposed on the many other countries around the world that continue to trade with Russia and how effective these secondary sanctions might be. The more effective the sanctions are, the greater the effect on world supply and hence on inflation. However, given that the EU continues to consume Russian energy it is unlikely that secondary sanctions will be a practical policy tool in the near future.
The continuation of China’s zero covid policy is also having a major impact on the Chinese economy and global supply chains. The WHO has stated that this policy is not sustainable given the highly transmissible variants of Covid currently spreading around the world. However, there is little sign of the Chinese government altering its current policy soon and certainly not before the March 2023 conclusion of the Party congress and expected renewal of Xi Jinping’s Presidency. Whilst the continuing Covid lockdowns are unpopular, the number of covid deaths even from the current milder strains would still be very large given the population of China.
Turning back to the June inflation figures, we can look in more detail at the contributions of the different sectors to overall inflation, we can look at the old inflation dropping out of the annual figure (May-June 2021) and the new monthly inflation dropping in (May-June 2022) and use the expenditure weights to calculate CPI. In the chart below, we show the “dropping out” in blue and the “dropping in” in light brown. The overall effect is the sum of the two and is shown as the burgundy line.
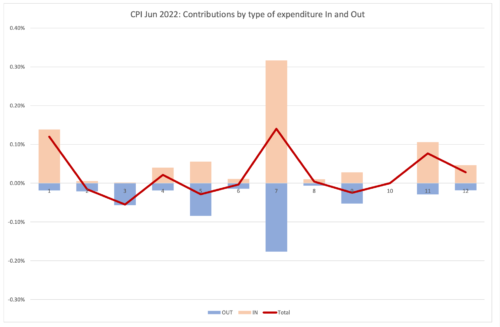

As we can see, the overall effect for most sectors is the result of a tug of war between the blue team pulling downwards as last year’s inflation drops out whilst the brown team pushes upwards with new inflation. The brown team is winning in some sectors, the blue team in others with some more in balance. Overall, the Brown team is pulling general inflation up by 0.3% this month.
Looking Ahead: Ukraine and beyond
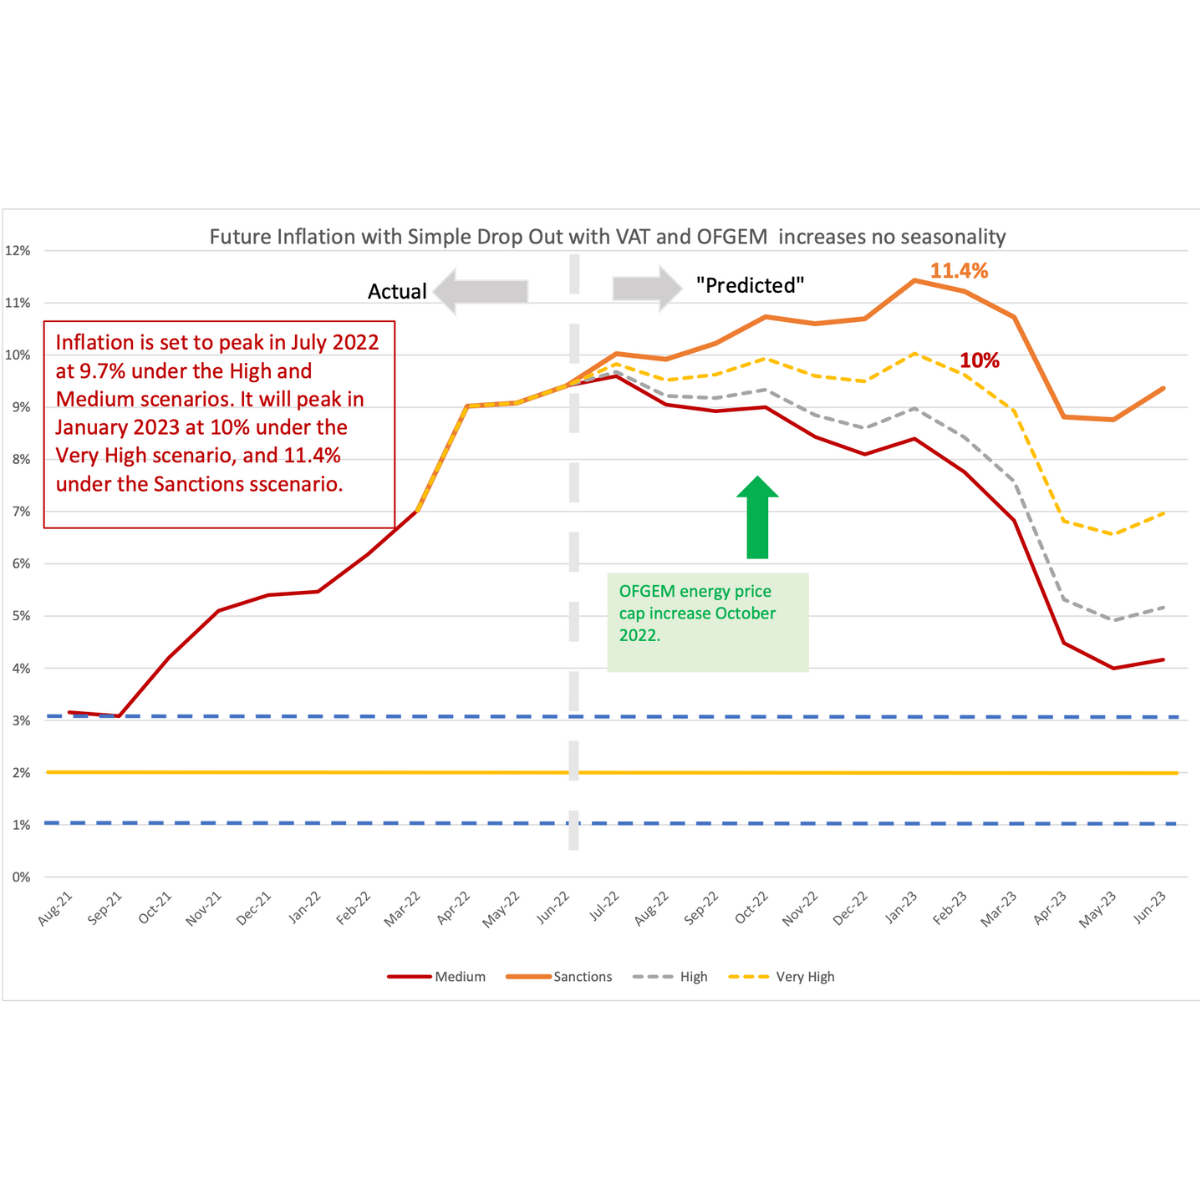
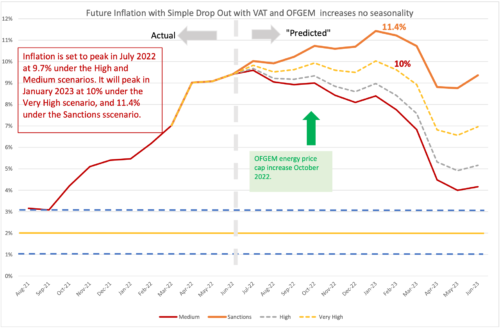
We can look ahead over the next 12 months to see how inflation might evolve as the recent inflation “drops out” as we move forward month by month. Each month, the new inflation enters into the annual figure and the old inflation from the same month in the previous year “drops out”.1 However, the recent invasion of the Ukraine by Russia and the western sanctions in response makes things even more uncertain. That said, the invasion and sanctions are certainly going to start increasing inflation as we go forward. We have therefore adjusted our four scenarios:
- The “medium” scenario assumes that the new inflation each month is equivalent to what would give us 2% per annum – 0.17% per calendar month (pcm) – which is both the Bank of England’s target and the long-run average for the last 25 years. This is a reference point only, as inflation will be well above this level for the next year or two.
- The “high” scenario assumes that the new inflation each month is equivalent to 3% per annum (0.25% pcm).
- The “very high” scenario assumes that the new inflation each month is equivalent to 5% per annum (0.4% pcm). This reflects the inflationary experience of the UK in 1988-1992 (when mean inflation was 0.45%). It also reflects the continuation of the UK average in the second half of 2021. This level of month-on-month inflation would indicate a significant break from the historic behaviour of inflation from 1993-2020.
- “Sanctions” scenario. This assumes that new inflation per month is 0.8%, equivalent to 10% per annum. This is a high figure, which is unlikely to be sustained for a prolonged period unless geopolitical conditions deteriorate.
We added the “Sanctions” scenario in March 2022 to reflect a lower bound on what we can expect as sanctions and the war itself affect global energy and commodity prices. We have dropped the “low” scenario from previous releases as this is now irrelevant. The “Very high” scenario is probably the central forecast, but of course there is very high uncertainty now.
In addition, we also have additional “drop ins” resulting from government policy: OFGEM. will increase the price-cap at the end of September 2022. With the recent behaviour of energy prices this seems likely to be a big increase which will show up in the October 2022 inflation figures. We have set this at 1.0% (although it is yet to be announced). The current issues with the gas supply via Nord Stream 1 to Germany may indicate that further increases in natural gas prices in Europe are in store this winter, and the Ofgem price cap may need to see another big rise in April 2023. This will be offset by the corresponding drop-out of the recent increase in April 2022. However, on a note of optimism, there is the possibility that the problems with exporting Ukrainian wheat may be resolved by the current negotiations between the warring parties overseen by the UN and hosted by Turkey.
The increase of inflation by 0.3% in June has raised the expected future path of inflation. Under the medium and high scenarios we had expected inflation to fall in May and June from the April “peak” that had been long expected. However, inflation has instead continued to increase in May and June. The peak for the Very High scenario is now at 10% in January 2023. Under the sanctions scenario the peak in January 2023 has increased to 11.4%. The Sanctions scenario seems to be in line with the Bank of England’s May Monetary Policy Report forecast.
In all scenarios, there is a rapid fall in inflation from February 2023, which is due to the drop out of the high inflation figures in the corresponding months this year.
Figure 2: Looking forward to June 2023
For further analysis of current and future prospects for inflation in the UK see:
1 This analysis makes the approximation that the annual inflation rate equals the sum of the twelve month-on- month inflation rates. This approximation ignores “compounding” and is only valid when the inflation rates are low. In future releases I will add on the compounding effect to be more precise at the current high levels of inflation.
Related Blog Posts


Related Projects


Related News


Why it’s not worth worrying that the UK has technically entered a recession
26 Feb 2024
4 min read

1.2 million UK Households Insolvent This Year as a Direct Result of Higher Mortgage Repayments
22 Jun 2023
2 min read
Related Publications

Recessionary Pressures Receding in the Rearview Mirror as UK Economy Gains Momentum
12 Apr 2024
GDP Trackers
Related events

Summer 2023 Economic Forum

Spring 2023 Economic Forum

Winter 2023 Economic Forum

Autumn 2022 Economic Forum

Summer 2022 Economic Forum

Spring 2022 Economic Forum

Winter 2022 Economic Forum
