Not even wrong: misreading the statistics on the benefit cap
Two days ago, Iain Duncan Smith blamed Conservative Party press office for misrespresenting the facts about claimants of Employment and Support Allowance (discussed previously by me and Declan Gaffney here), saying
Authors
Two days ago, Iain Duncan Smith blamed Conservative Party press office for misrespresenting the facts about claimants of Employment and Support Allowance (discussed previously by me and Declan Gaffney here), saying
I’ve tried to get my colleagues at Central Office to check first before they put anything out about the areas that the DWP covers because it’s complex.
Unfortunately the message doesn’t seem to have got through. Yesterday Conservative Party press office (@CCHQPress on twitter) tweeted this chart:
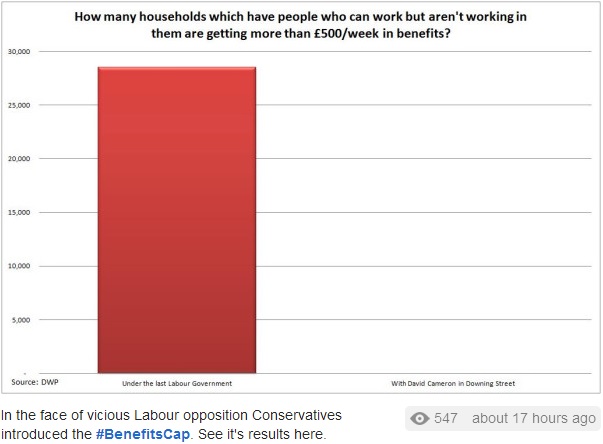
Like other grammatical pedants, I cringed at the misplaced apostrophe, but let’s focus on the numbers. The chart claims that the number of households which contain “people who can work but aren’t working in them” and are “getting more than £500 per week in benefits” has been reduced from 28,5000 to zero. This is based on DWP statistics published last week, which show that about 28,500 households have had their benefit capped at £500 per week. However, the interpretation – and the chart – is utterly wrong in every respect.
First, it just is not the case that every one of those 28,500 households contains someone who “can work”. As the DWP publication clearly states, the cap applies to households in receipt of key out of work benefits – including both those in the Employment and Support Allowance (ESA) Work-Related Activity Group (WRAG) and those on Income Support (IS). For people in the WRAG, the position is quite clear. As the DWP itself puts it, for example here, they are:
currently too ill or disabled to work
What about those on Income Support? Once again, DWP makes clear that there is no assumption that IS claimants “can work”, but quite the opposite. As a general rule, most people who “can work” should be on Jobseekers Allowance (JSA) not IS. In practice, most of those on IS are single mothers with young children, who are not expected to work.
So, a substantial proportion of the 28,500 households who have had their benefit capped do not contain people who “can work but aren’t working”. How many? The Chartered Institute of Housing looked in detail at those affected by the benefit cap in Haringey (one of the local authorities with the most affected households). It found that 19% were on ESA, and 49% on IS; just 23% were on JSA (and hence definitely included had someone who, according to DWP, “can work”). Overall, although we don’t have precise numbers from the DWP statistics, it seems quite likely that in fact less than half of the households affected by the cap contain “people who can work but aren’t”.
What about the second number on the chart – the claim that there now are precisely zero households receiving more than £500 per week in benefits that include “people who can work but aren’t”. This is just as wrong. Once again, back to the DWP source:
All households with someone, including a child, with a current award of Disability Living Allowance, Personal Independence Payment or Attendance Allowance, or receiving the support component of Employment and Support Allowance or Industrial Injuries Benefits (and those receiving War Disablement Pension and the equivalent payments from the Armed Forces Compensation Payments Scheme) are exempt from the benefit cap.
Of course it’s perfectly possible for such households to contain “people who can work but aren’t” – most obviously households with a child receiving DLA, but there are lots of other possible cases. Moreover, even this excludes couple households where one person is working but the other could work, but is not, who are also exempt. Given enough children and/or high enough housing costs, such households can receive more than £500 per week in benefits. Again, we don’t know the exact numbers, but we are certainly talking about thousands of households, not zero.
In conclusion, there is absolutely no information in this chart that is true, or even close to being true. Will @CCHQPress correct it? Well, the reason I noticed it and thought it was worth writing about was because it was retweeted by Michael Fabricant MP. Now, my past interaction with Mr Fabricant – see here – shows that, while he may sometimes tweet first and think later, he is an honourable man who cares about getting things right and is prepared to correct the record if he inadvertently makes a mistake. Sadly, this is rarer than it should be on twitter (see, for example, the shocking dishonesty of Dan Hannan MEP for a really extreme example of bad behaviour). So I hope Mr Fabricant will be able to prevail on @CCHQPress to do the right thing.
Related Blog Posts


What Are the Implications of the Rising National Minimum Wage and National Living Wage Rates?
19 Mar 2024
5 min read


Related Projects


Related News


Press Release: Compositional effects push up average weekly earnings at the end of 2020
26 Jan 2021
2 min read
Press Release: 2020 shaping up to be the worst year for total pay growth since 2009
15 Dec 2020
2 min read
Related Publications

Pay-Setting Among Employers in the Agriculture, Cleaning, Hospitality and Retail Sectors
11 Mar 2024
Research Report

Job Boom or Job Bust? The Effect of the Pandemic on Actual and Measured Job and Employment Growth
07 Feb 2024
UK Economic Outlook Box Analysis

Kurzarbeit/Short Time Working: Experiences and Lessons from the Covid-Induced Downturn
20 Nov 2023
National Institute Economic Review

Related events