Rise in Domestic Energy Prices Drives Surge in Headline Inflation
Authors

CPI rose to 9% in April from 7% in March. The change in the headline inflation rate was the highest since the 1980s. Month on month inflation between March and April at 2.5% was the highest since April 1991. The main driver of the increase was the increase in domestic energy prices following the rise in the OFGEM price cap: electricity rose by 41% from the previous month, and gas by 67%.
Inflation in other sectors remains above the historic norms, but we await to see the full effect of war and sanctions in the coming months. The main contributors to the surge in inflation were:
- Housing, Water, Electricity and Gas 5%
- Recreation and Culture 1%
- Food and Non-Alcoholic Beverages 1%
The surge in prices in April followed on from large increases in February and March, showing that inflation has become entrenched. Food inflation in particular has been rising rapidly since September 2021. Prior to the outbreak of war in Ukraine, we expected inflation to peak in April 2022 with the OFGEM price cap being raised. However, we think that inflation is more likely to remain at its current level or higher for most of 2022.
The future path of inflation depends crucially on how the war itself affects the world economy and more importantly the impact of sanctions imposed on Russia by the Western powers. The war and sanctions are having major effects on certain commodities, including wheat and other grains, fertiliser, neon gas, various metals and of course energy (see last month’s blog for more details).
The price of all these commodities will be affected to some extent and the ensuing restrictions on supply will be a major driver of inflation in the UK and around the world. Currently, sanctions have been imposed by what are often called the “Western powers”, the US, Canada, EU, UK and their close allies in the far East (Japan, South Korea, Singapore and Taiwan). The impact of sanctions on the UK economy will also depend on whether secondary sanctions are imposed on the many other countries around the world that trade with Russia and how effective these secondary sanctions are. The more effective the sanctions are, the greater the effect on world prices and hence on inflation. However, given that the EU continues to consume Russian energy it is unlikely that secondary sanctions will be a practical policy tool.
The continuation of China’s zero covid policy is also having a major impact on the Chinese economy and global supply chains. The WHO has stated that this policy is not sustainable given the highly transmissible variants of Covid currently spreading around the world. However, there is little sign of the Chinese government altering its current policy soon.
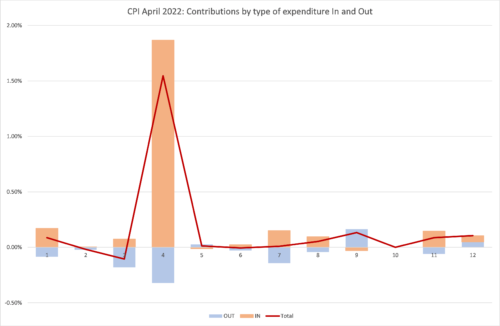
Turning back to the April inflation figures, we can look in more detail at the contributions of the different sectors to overall inflation. We can look at the old inflation dropping out of the annual figure (March-April 2021) and the new monthly inflation dropping in (March-April 2022) and use the expenditure weights to calculate CPI inflation. In the chart below, we show the “dropping out” in blue and the “dropping in” in light brown. The overall effect is the sum of the two and is shown as the burgundy line.
The increase in Housing, water and energy dwarfs all else, but what is even more remarkable is that the effect on headline inflation was dampened by the large drop-out of the previous April’s OFGEM price cap increase. In terms of new inflation from March to April, it was positive across all types of expenditure except for Recreation & Culture and Furniture & Household equipment. The monthly increases were high in Communications (3.8%), Food & Non-alcoholic Beverages (1.5%), Restaurants & Hotels (1.7%). The overall effect of Clothing & Footwear on inflation is negative (-0.1%) only because of increases dropping out from the April 2021 figure and all other sectors show a positive overall impact on inflation.

Extreme Items.
Out of over 700 types of goods and services sampled by the ONS, there is a great diversity in how their prices behave. Each month some go up, and some go down. Looking at the extremes, for this month, the top ten items with the highest monthly inflation rate are:
| Table 1: Top ten items for month-on-month inflation (%), April 2022 | |
| GAS | 68.82 |
| ELECTRICITY | 40.55 |
| MASCARA | 33.23 |
| GOLF GREEN FEES | 31.60 |
| HOUSEHOLD CLEANER CREAM/LIQUID | 22.23 |
| PATIO TABLE & CHAIRS-SEASONAL | 20.33 |
| MUSIC DOWNLOADS | 19.41 |
| HOUSEHLD SERVICES MAINT POLICY | 17.85 |
| EURO TUNNEL FARES | 17.61 |
| ATTRACTIONS | 17.24 |
Gas and electricity play a starring role, but Mascara using Golfers were also hit hard.
The ten items with the highest negative inflation this month are shown in Table 2.
| Table 2: Bottom ten items for mom inflation (%), April 2022 | |
| CREAM LIQUER 70CL-1LT 14-20% | -7.76 |
| FRUIT DRINK BOTTLE 4-8 PACK | -10.71 |
| CURTAINS READY MADE SP’FY SIZE | -11.12 |
| COMPUTER GAME 3 | -12.54 |
| CDS- PURCH OVER INTERNET | -12.69 |
| COMPUTER GAME 2 | -15.15 |
| DIGITAL MEDIA PLAYER | -17.18 |
| MONEY TRANSFERS | -17.44 |
| ROADSIDE RECOVERY SERVICE | -19.20 |
| SMART SPEAKER | -39.20 |
April was definitely the time for stocking up on cream liqueur and snapping up computer games and CDs. Smart speakers seem to have become really cheap last month.
In both these tables we look at how much the item price-index for this month has increased since the previous month, expressed as a percentage. These calculations were made by my PhD student at Cardiff University, Yang Li.
Looking Ahead: Ukraine and beyond
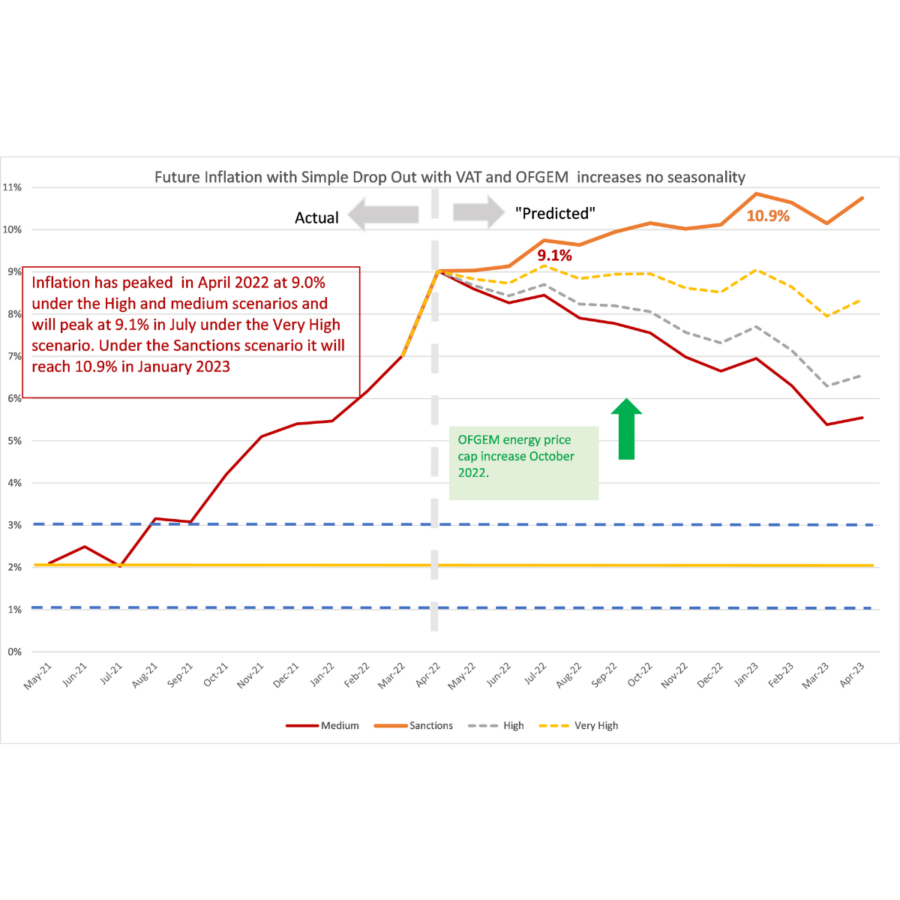
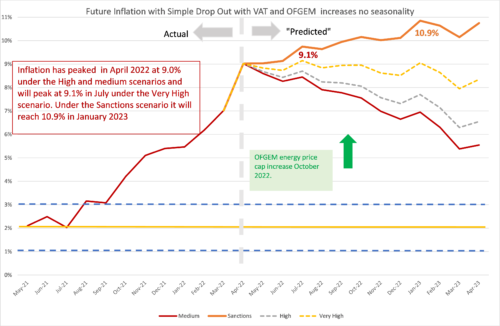
We can look ahead over the next 12 months to see how inflation might evolve as the recent inflation “drops out” as we move forward month by month. Each month, the new inflation enters into the annual figure and the old inflation from the same month in the previous year “drops out”.[1] However, the recent invasion of Ukraine by Russia and the western sanctions in response makes things even more uncertain. That said, the invasion and sanctions are certainly going to start increasing inflation as we go forward. We have therefore adjusted our scenarios.
We do this under four scenarios.
- The “medium” scenario assumes that the new inflation each month is equivalent to what would give us 2% per annum – 0.17% per calendar month (pcm) – which is both the Bank of England’s target and the long-run average for the last 25 years. This is a reference point only, as inflation will be well above this level for the next year or two.
- The “high” scenario assumes that the new inflation each month is equivalent to 3% per annum (0.25% pcm).
- The “very high” scenario assumes that the new inflation each month is equivalent to 5% per annum (0.4% pcm). This reflects the inflationary experience of the UK in 1988-1992 (when mean inflation was 0.45%). It also reflects the continuation of the current UK average in the second half of 2021. This level of month-on-month inflation would indicate a significant break from the historic behaviour of inflation from 1993-2020.
- “Sanctions” scenario. This assumes that new inflation per month is 0.8%, equivalent to 10% per annum. This is a high figure, and is unlikely to be sustained for a prolonged period unless geopolitical conditions deteriorate.
We have added the “Sanctions” scenario to reflect a upper bound on what we can expect as sanctions and the war itself affect global energy and commodity prices. We have dropped the “low” scenario from previous releases as this is now irrelevant. The “Very high” scenario is probably the central forecast, but of course there is very high uncertainty now.
In addition, we also have additional “drop ins” resulting from government policy: OFGEM. will increase the price-cap at the end of September 2022. With the recent behaviour of energy prices there also seems likely to be a big increase in September 2022 which will show up in the October 2022 inflation figures. We have set this at 0.7% (although it is yet to be announced).
The high level of inflation recorded in April has shifted up our forecast of inflation from last month. The patterns of the medium and high projections are similar, after the April peak, inflation heads down and by April 2023 drops to 3% in the medium scenario and 4% in the high scenario. This means that inflation will remain well above the Bank of England’s target of 2% for some time to come even if underlying inflation remains at its historic average as in the medium scenario.
In the very high inflation scenario, inflation heads up to 9% by July 2022 and remains close to that level until January 2023. In the sanctions scenario, we see inflation peaking at almost 11% in January 2023. By April 2023 inflation will remain above 5% in both scenarios.
In all scenarios, there is a rapid fall in inflation from February 2023, which is due to the dropping out of the high inflation figures in the corresponding months this year.
Figure 2: Looking forward to April 2023
For further analysis of current and future prospects for inflation in the UK see:
Will Inflation take off in the UK? The Economics Observatory.
https://www.niesr.ac.uk/publications/powering-down-not-levelling-up?type=uk-economic-outlook
[1] This analysis makes the approximation that the annual inflation rate equals the sum of the twelve month-on-month inflation rates. This approximation ignores “compounding” and is only valid when the inflation rates are low. In future releases I will add on the compounding effect to be more precise at the current high levels of inflation.
Related Blog Posts


Related Projects


Related News


Why it’s not worth worrying that the UK has technically entered a recession
26 Feb 2024
4 min read

1.2 million UK Households Insolvent This Year as a Direct Result of Higher Mortgage Repayments
22 Jun 2023
2 min read

The Key Steps to Ensuring Normal Service is Quickly Resumed in the Economy
13 Feb 2023
4 min read
Related Publications

Recessionary Pressures Receding in the Rearview Mirror as UK Economy Gains Momentum
12 Apr 2024
GDP Trackers
Related events

Summer 2023 Economic Forum

Spring 2023 Economic Forum

Winter 2023 Economic Forum

Autumn 2022 Economic Forum

Summer 2022 Economic Forum

Spring 2022 Economic Forum

Winter 2022 Economic Forum
