Inflation Still Likely to Fall to 2 per cent or Below Next Month
Authors
Annual CPI Inflation was 3.2 per cent in March 2024, down from 3.4 per cent in February 2024. This was largely driven by the high monthly figure from March 2023 of 0.8 per cent dropping out and the new inflation for March 2024 coming in at the high level of 0.6 per cent on the month, yielding the overall fall of 0.2 percentage points in the headline figure. The month-on-month rate of 0.6 per cent was the same as the previous month and if sustained for 12 months would lead to an annual figure of over 7 per cent. Measures of underlying inflation are a better guide to the longer-term outlook, and these are falling now: annual CPI inflation in services is down to 6.0 per cent from 6.1 per cent in the previous month and core CPI (excluding Food and Energy) inflation is down to 4.2 per cent from the previous month’s 4.5 per cent. NIESR’s trimmed mean measure of core inflation is also down to 3.1 per cent from 3.9 per cent in February.
The fall in inflation was reflected across most sectors, with the biggest contributors being:
Food and Non-alcoholic beverages -0.11 percentage points
Furniture and household Goods -0.07 percentage points
Clothing and Footwear -0.06 percentage points
The main exceptions were increases in:
Transport 0.04 percentage points
Communication 0.04 percentage points
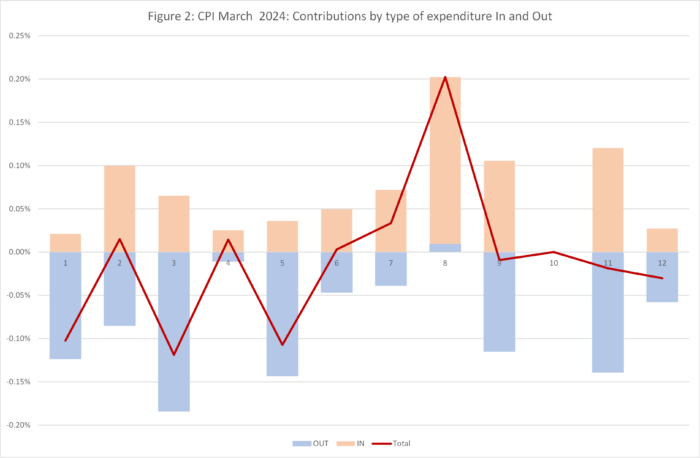
We can look in more detail at the contributions of the different sectors to overall inflation in Figure 2, with the old inflation dropping out of the annual figure (February-March 2023) shown in blue and the new monthly inflation dropping in (February-March 2024) shown in brown, using the new January 2024 expenditure weights to calculate CPI. The overall effect is the sum of the two and is shown as the burgundy line.
We can see our old story of the ‘Blue team’ pulling inflation down across almost all sectors as last year’s high figures drop out, whilst the ‘Brown team’ is positive in almost all sectors. So, the high overall month on month figure of 0.6% is coming from all sectors, with big contributions in Communications and Restaurants and Hotels, Clothing and Footwear along with Furniture and Household Equipment. Even Food and Non-Alcoholic Beverages comes in positive as part of the Brown team, despite the overall negative effect due to the big Blue drop out.
![]()
Extreme items
| Table 1: Top ten items for month-on-month inflation (%), March 2024 | |
| Smart Speaker | 50.03 |
| Ebooks | 45.68 |
| Computer Game 2 | 43.35 |
| Computer Game 3 | 21.65 |
| Mobile Phone Applications | 20.08 |
| Internet Computer Games | 19.91 |
| Roadside Recovery Service | 14.16 |
| Computer Software | 13.98 |
| Hotel 1 Night Price | 13.26 |
| Charcoal Bbq Not Disposable | 11.66 |
March was not a good month for internet related activities.
The ten items with the highest negative inflation this month are shown in Table 2
| Table 2: Bottom Ten Items For Month-on-Month Inflation (%), March 2024 | |
| Fruit/Veg Smoothie | -8.34 |
| Dairy Free Spread/Margarine | -8.35 |
| Milk Flavoured, 180-500mls/Gms | -9.89 |
| Book – Fiction – Hard Cover | -10.30 |
| Air Fryer Specify Capacity | -10.34 |
| Printer | -10.70 |
| Euro Tunnel Fares | -12.53 |
| Internet Blu-Ray Disc | -12.67 |
| Electric Toothbrush | -12.71 |
| Electric Razor | -17.96 |
March was a great month for old school things – books, Blu-ray Discs, margarine.
In both these tables we look at how much the item price-index for this month has increased since the previous month, expressed as a percentage. These calculations were made by my former PhD student at Cardiff University, Dr Yang Li who has since returned to Shanghai.
Looking forward to March 2025
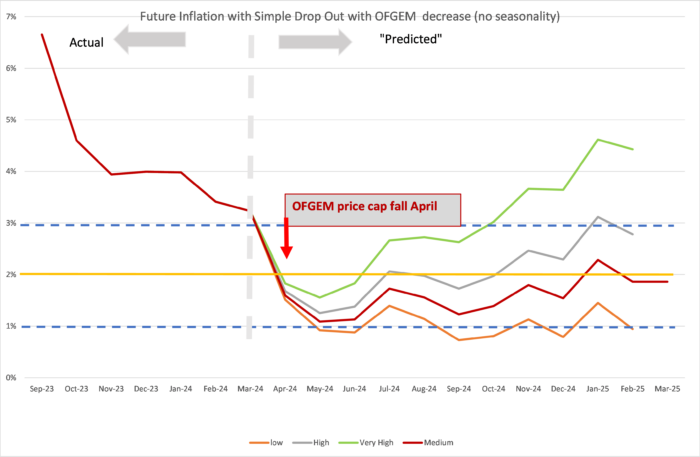
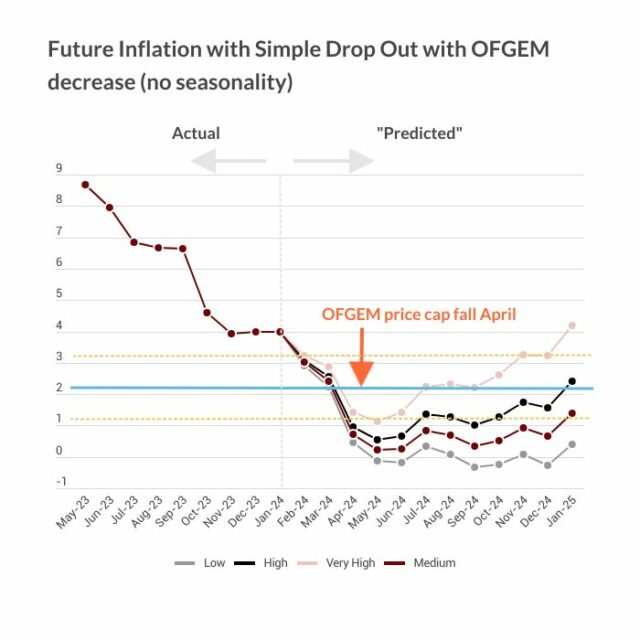
We can look ahead over the next 12 months to see how inflation might evolve as the recent inflation “drops out” as we move forward month by month. Each month, the new inflation enters the annual figure and the old inflation from the same month in the previous year “drops out”.[1] Previously we ended the “low inflation” scenario but have reintroduced it in response to some recent months with near zero month-on-month inflation. We have also dropped the “High inflation persistence” scenario as it now looks unlikely unless geopolitical factors deteriorate significantly. We depict the following scenarios for future inflation dropping in:
- The “medium” scenario assumes that the new inflation each month is equivalent to what would give us 2 per cent per annum or 0.17 per cent per calendar month (pcm) – which is both the Bank of England’s target and the long-run average for the last 25 years.
- The “high” scenario assumes that the new inflation each month is equivalent to 3 per cent per annum (0.25 per cent pcm). This is now the central forecast.
- The “very high” scenario assumes that the new inflation each month is equivalent to 5 per cent per annum (0.4 per cent pcm). This reflects the inflationary experience of the United Kingdom in 1988-1992 (when mean monthly inflation was 0.45 per cent).
- The “low” scenario assumes inflation each month is equivalent to 1% per annum (0.08 per cent pcm).
Previously we have followed the “very high” or “high” scenarios. We still think that the new figures are likely to come in on average somewhere between the two in the coming months. However, there is a special factor: in April there is going to be a fall in the OFGEM price cap resulting in a downward push of 0.6 percentage points (plus the drop out of the April 2023 increase in the price-cap). Overall, there will be a blue “drop out” reducing inflation by 1.2 percentage points and the new OFGEM drop in of -0.6 percentage points, so these two factors will lead to an overall fall in the headline inflation of 1.8 percentage points less the “new inflation” in the various scenarios. In all scenarios, we see the high inflation from the first two quarters of 2023 dropping out and this will drag CPI inflation down until May 2024.
The latest ONS data (covering the three months to February 2024) suggest that wages are growing at 6 per cent (excluding bonuses). That is, wage growth remains high as wages continue to catch up with past inflation. We can expect this to continue and put upward pressure on prices, particularly in the service sector. The inflation rate in services remains high at 6.0 per cent but is falling, whilst core inflation (excluding food and energy) has dropped to 4.2 per cent. These factors indicate that inflationary pressures are likely to persist well into 2024. However, the dropping out of the high inflation rates from 2023 will tend to dominate and drive down headline inflation for the first half of 2024 despite these persistent inflationary pressures. On a more optimistic note, today’s NIESR trimmed mean inflation measure has fallen significantly to 3.1 per cent which is below headline inflation for the first time this year.
The fact that the new inflation was extremely high at 0.6 per cent has raised our forecast for inflation as we move forward compared to last-months expectations. We still believe the most likely outcome lies between the high and very high scenarios, and this means that inflation in April will be 1.7-1.8 per cent falling to 1.3-1.6 per cent in May. Under the low and medium scenarios, inflation will bottom out at around 1 per cent in May to June. However, if the new month on month inflation comes in at the level of 0.6 per cent, then inflation might remain above 2 per cent in April. Under all scenarios, inflation will bounce back in line with the underlying rate of new inflation in each scenario. If the new month on month inflation remains high, we may need to revise our most likely scenario upwards.
This forecast assumes that geopolitical tensions do not deteriorate. Direct conflict between Russia and NATO would rapidly worsen the picture for inflation. Looking east, if the rising tensions between the United States and China lead to an intensification of the trade war or even open military conflict in the South China Sea or Republic of China (Taiwan), world supply chains would be disrupted, and inflation significantly raised, to levels far higher than seen in 2022.
The current conflict in the middle east seems to be spreading beyond Israel and Gaza. Already the Houthi’s have disrupted trade through the Red Sea and Suez Canal. If Iran becomes involved and the straits of Hormuz are also blocked, then this will have a major effect on the supply of goods and particularly oil and liquified natural gas (LNG) which could significantly increase inflation. The effect of direct conflict between Israel and Iran would not only cause a spike in oil and LNG prices but also a negative effect on supply chains in general. For example, the possibilities for air flights between Europe and Asia would become very limited (given that Russian airspace is already closed to those countries sanctioning Russia), if Middle Eastern airspace became unsafe.
For further analysis of current and future prospects for inflation in the UK see:
[1] This analysis makes the approximation that the annual inflation rate equals the sum of the twelve month-on-month inflation rates. This approximation ignores “compounding” and is only valid when the inflation rates are low. In future releases I will add on the compounding effect to be more precise at the current high levels of inflation.
Related Blog Posts


Related Projects


Related News


Why it’s not worth worrying that the UK has technically entered a recession
26 Feb 2024
4 min read

1.2 million UK Households Insolvent This Year as a Direct Result of Higher Mortgage Repayments
22 Jun 2023
2 min read

The Key Steps to Ensuring Normal Service is Quickly Resumed in the Economy
13 Feb 2023
4 min read
Related Publications

Recessionary Pressures Receding in the Rearview Mirror as UK Economy Gains Momentum
12 Apr 2024
GDP Trackers
Related events

Summer 2023 Economic Forum

Spring 2023 Economic Forum

Winter 2023 Economic Forum

Autumn 2022 Economic Forum

Summer 2022 Economic Forum

Spring 2022 Economic Forum

Winter 2022 Economic Forum
