UK productivity growth: careful what you wish for
UK productivity has been woefully poor since the onset of the Global Financial Crisis and has surprised forecasters to the downside. At the same time, employment has surprised to the upside and the employment rate has now reached record highs. In this blog we show that there is a long-established negative association between employment and productivity growth in the UK data, which signals a potential trade-off with far-reaching implications for public finances, Brexit and overall welfare.

Authors
UK productivity has been woefully poor since the onset of the Global Financial Crisis and has surprised forecasters to the downside. At the same time, employment has surprised to the upside and the employment rate has now reached record highs. We show that that there is a long-established negative association between employment and productivity growth in the UK data, which signals a potential trade-off with far-reaching implications for public finances, Brexit and overall welfare.
The Office for Budget Responsibility (OBR) will publish its latest outlook for public finances and the economy on Wednesday alongside the Autumn Budget. On the OBR’s own calculations, a trend productivity forecast that proves to be just 0.3 percentage points too optimistic will wipe out half of the £26 billion headroom against the fiscal rule for the structural deficit. The importance of this forecast cannot be overstated.
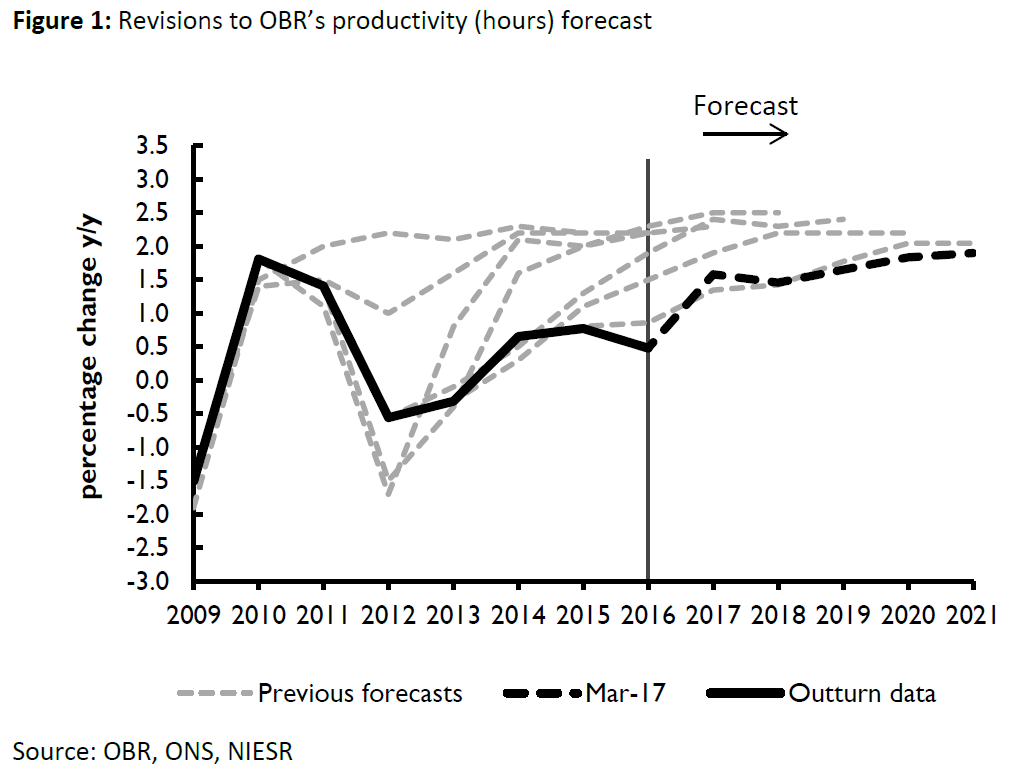
Productivity growth has slowed in the G7 since the financial crisis. The UK stands out as a laggard within this group with productivity more or less stagnant for the past ten years – the UK experience has been referred to as a puzzle. It is hardly surprising then that forecasts published by the OBR and others have turned out to be systematically optimistic since 2010. Figure 1 below shows that output per hour briefly bounced back after the crisis but has fallen well short of the 2 per cent growth that was repeatedly expected in forecasts since then (Figure 1).
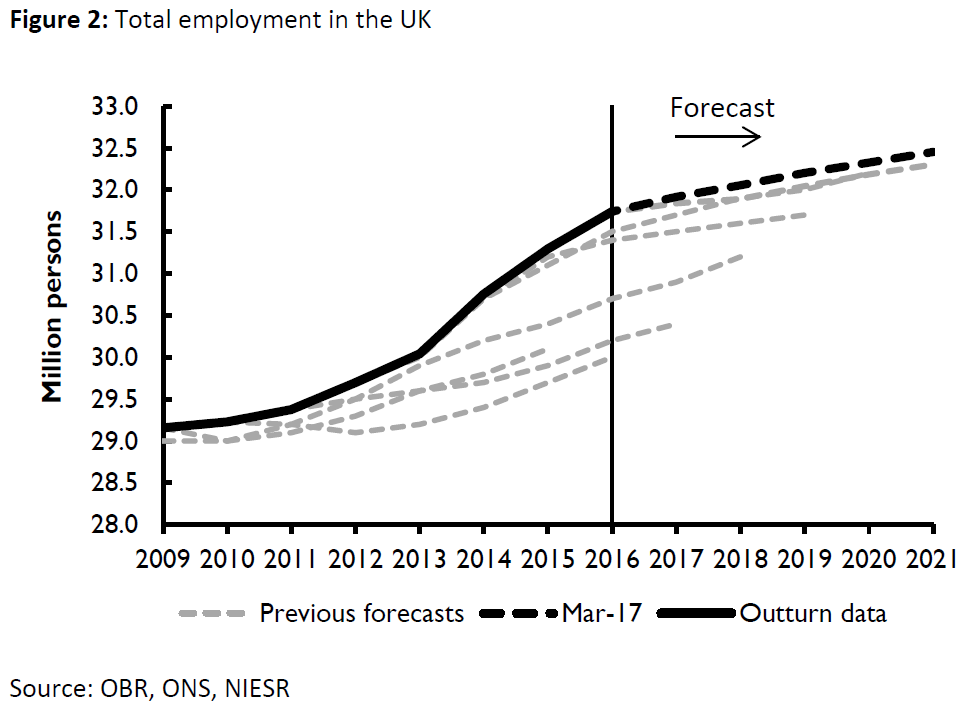
At around the same time we also find that employment forecasts, whether measured in total hours worked, the numbers employed, the employment rates or even participation rates, have surprised to the upside (Figure 2). The employment rate stands at a record high of 75% in the third quarter of 2017.
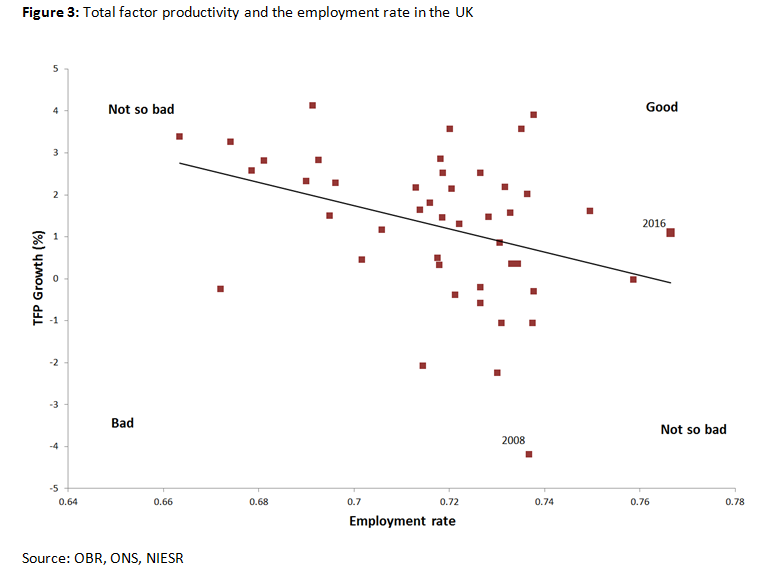
A striking observation is that there is a negative relationship between employment and productivity. We find that there is a long-standing trade-off between employment and productivity such that periods of high productivity are associated with low employment and vice versa. That relationship is clearly evident in Figure 3 below which shows total factor productivity (TFP) and employment using annual data for the last 44 years. TFP is thought to capture technological change and efficiency gains and is generally considered to be independent of an increase in the quantity and quality of labour and capital inputs.
One plausible explanation is that the economy could move along the best fit line shown in Figure 3 depending on the availability of labour. Alternatively, the line itself could move up or down in response to a major event such as Brexit. To be sure, these are just examples – we are not suggesting any causal link between productivity and employment, we are simply stating that the two variables seem to be associated with each other and that may be the result of one driving the other or alternatively, because of common factors are driving both. More research is required to understand the relationship between the labour market and TFP.
The same relationship holds for a number of productivity measures and also with industry-level data Figure 4 below shows the relationship between annual growth rates in TFP and growth rates in total employment for about 30 industries in the UK over 17 years. While this trade-off holds for the UK when looking at both the pre-crisis and the post-crisis, this is not always the case for other economies and this therefore requires further investigation.

Most economists will agree that welfare is maximised when productivity and employment are high. In Figure 3, the top right quadrant characterises the policy maker’s quest or the ‘Good’ outcome and the bottom left has been labelled the ‘Bad’ outcome. The two other ends of the figure, labelled the ‘not so bad’ quadrants are, in fact, where the UK economy tends to mostly reside. The economy is very rarely in the ‘Good’ quadrant and the latest full year observation for 2016 in Figure 3 is at the bottom right of the chart within the ‘not so bad’ quadrant. Again, it is worth reiterating that this trade-off is not evident to the same extent in other large economies such as United States, France or Germany.
To be sure, there are multiple factors that have contributed to the recent poor productivity performance and these range from low investment, data mis-measurement, industry composition changes, `zombie’ firms, funding constraints etc. But what mostly explains the labour productivity slowdown is a worsening in total factor productivity, observed both in market services and the manufacturing sector (EUKLEMS database, 2017). This blog suggests that a full explanation of the UK productivity puzzle must also consider the relationship with employment.
Why does this matter?
- To start with, our analysis shows that productivity growth and employment should be assessed together rather than independently of each other. More research would be needed to understand better the underlying mechanisms driving this trade-off, as it is not observed uniformly across countries, industries or time periods.
- If indeed the negative relationship established in these charts holds, and there are structural reasons behind this, it might be unrealistic to expect a high employment/high productivity economy at least for a sustained period of time. With that in mind, weight should be placed on employment as well as productivity growth when assessing whole economy welfare and in so far as welfare is closely associated with employment, the high employment/low productivity equilibrium may be superior to the high productivity/low employment equilibrium.
- Finally, from a fiscal standpoint, the low productivity/high employment equilibrium might be superior because higher employment not only generates additional tax revenue (direct and indirect), it also lowers welfare payment. High productivity will also generate additional tax returns but in so far as the benefit will accrue to those already employed, the marginal propensity to consume might be smaller for this group. Here again, more work needs to be done to assess the fiscal implications of different equilibrium states.
How will Brexit impact on productivity?
There are likely to be at several influences from Brexit on labour and TFP. Firms might be forced to reorganise business, invest in new capital and machinery, and introduce other types of innovations, if the skill shortages that emerge as a result of less net migration can be addressed by these initiatives. That could help raise labour productivity and also potentially TFP, which would imply a shift in the technological frontier and in this case a move up the best fit line in Figure 4.
On the flip side, it is also possible that labour productivity falls because of a shortage of the type of skilled workers that cannot be replaced by investment in capital and machinery. Another related factor that might decrease TFP is a breakdown of diffusion mechanisms of technology and knowledge generated elsewhere, for example through lower FDI. In a recent speech, Bank of England Governor Carney suggested in a recent speech that a 20 per cent reduction in international trade lowers productivity by around 5 per cent in the long run and cited the disruption to supply chains and a loss in comparative advantage. And in these scenarios we could observe a shift to a worse equilibrium characterised by low employment growth-low TFP growth.
Related Blog Posts


Related Projects


Related News


Related Publications


Productivity and Investment: Time to Manage the Project of Renewal
12 Mar 2024
UK Productivity Commission
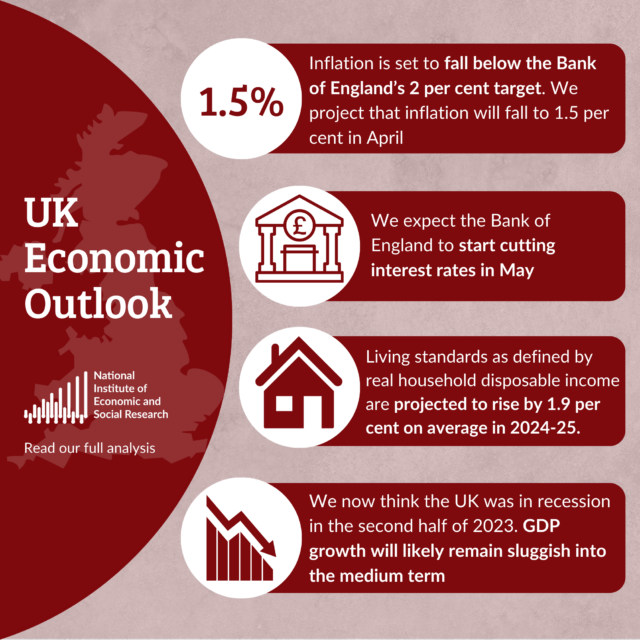
UK Households Should Start Feeling Better Off as Election Looms
07 Feb 2024
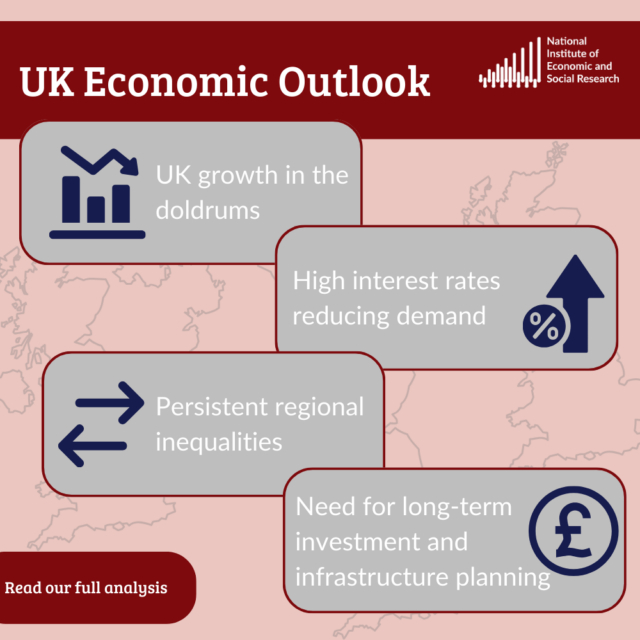
UK Economic Outlook
Low to Middle Income Households Facing Seven Years of Falling Living Standards
08 Nov 2023
UK Economic Outlook
Related events

Investing for Growth: boosting productivity through higher public and private investment

The Outlook for the Welsh Economy

Prais Lecture with Chris Pissarides: The Future of Work and Wellbeing
A View and Prospects for British Investment

How Can We Raise Investment?
Productivity Commission Evidence Session: Examining the Role of International Investment

High Dimensional Forecasting and its Pitfalls – M. Hashem Pesaran