The Unequal Impact of Rising Inflation
As the cost-of-living pressures grow, headlines focus largely on the increase in inflation but much less so on the distributional impact across different income groups. Our Deputy Director Professor Adrian Pabst spoke with Max Mosley, a NIESR economist, about the findings of his research in this key area of public policy.

Authors
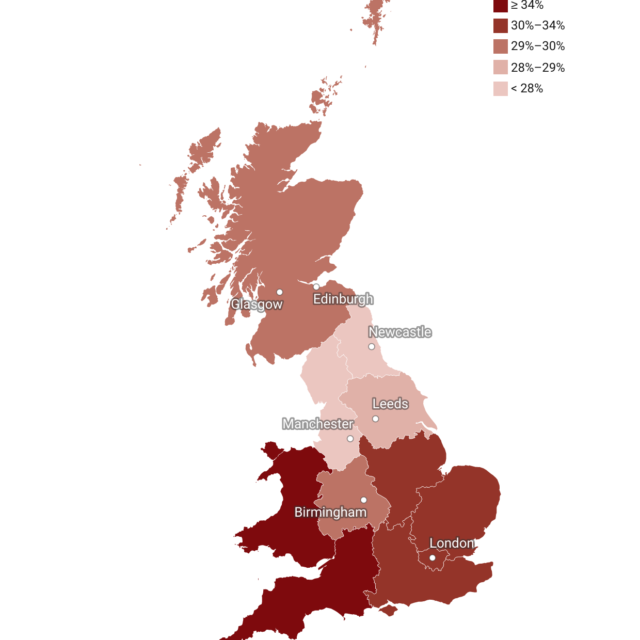
The cost-of-living crisis is hitting the lowest income households hardest, as they spend a greater proportion of their income on fuel and food, and those households are heavily concentrated in some of the most economically deprived areas of the country, including parts of the North-West, Wales and pockets in London/South-East.
Rising inflation will exacerbate inequality. The bulk of the effect of rising inflation comes from rising fuel and food prices. However, variation across income groups in their basket of food items and corresponding inflation also contributes to the cost-of-living pressures on the poorest in society.
Why is inflation disproportionately affecting low-income households?
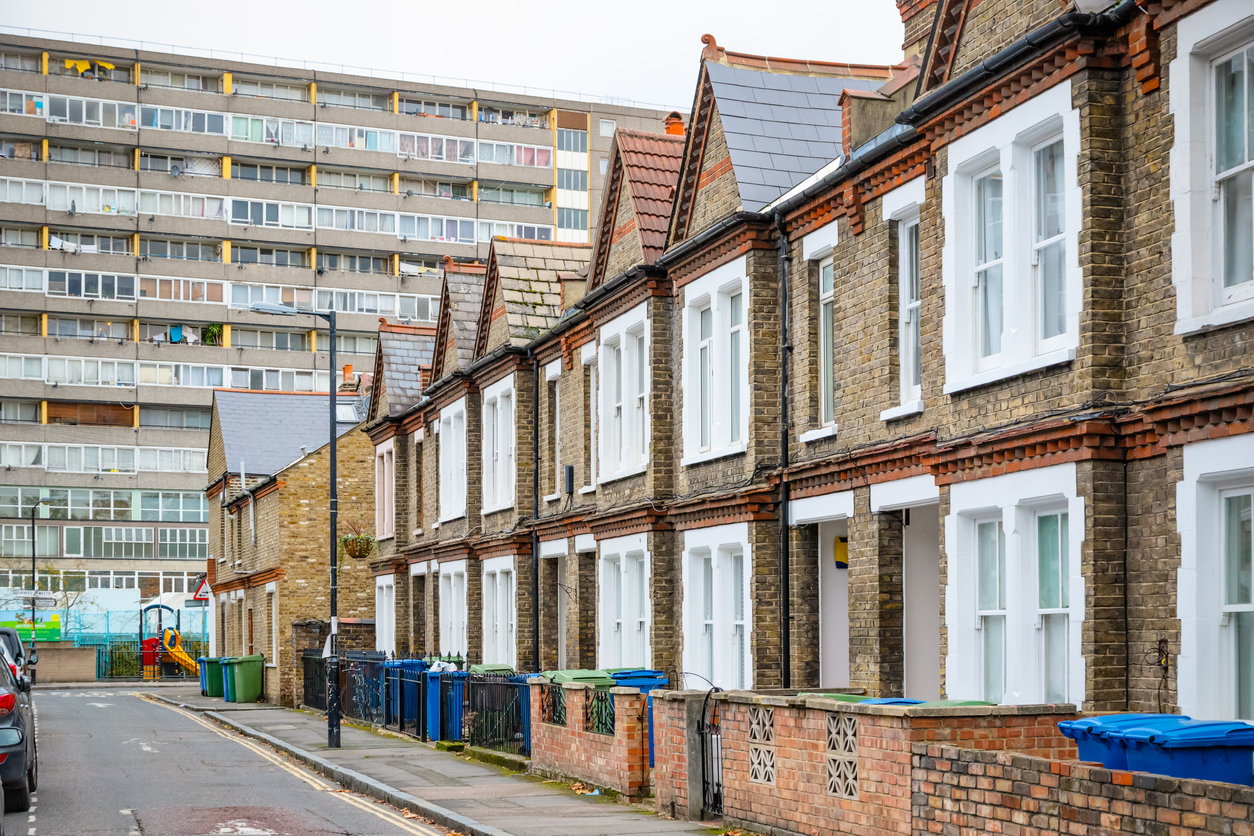
The rise in energy and food costs could not have come at a worse time. The first issue is that these are essential products which take up a larger proportion of the budget of low-income households than other income groups. This is partly because, in the case of energy, low-income households tend to live in older, less energy-efficient houses and in colder parts of the country so require more heating. To put this into perspective, these price rises will result in the poorest households spending the same proportion of their income on food per week as the richest spend on restaurants.
But the second, perhaps more critical issue, is that they cannot reduce spending on these areas without incurring significant harm. When the price of beer rises, you will probably drink less, but when your food and heating bills rise, the choice is much harder.
The third is that these households are the ones with least number of financial options available that can absorb these price rises. If this were to happen to higher-income households, they can use their savings, credit-cards, investment holdings and so on to act as a buffer to unexpected price rises. Low-income households not only do not have the same resources but also lost their £20 Universal Credit uplift last year, so their budgets are getting squeezed from both directions. We will be shedding some more light on this in our UK Outlook released on 8th February.
If we are facing a cost-of-living crisis, will the increase in National Insurance contributions make the situation worse?
Unfortunately, the answer is yes. With NHS waiting lists going up and the unresolved question of adult social care, the government decided last autumn to raise National Insurance contributions as of April this year, which is projected to raise £12bn a year and will for the first three years be injected into the health service, after which it will go towards funding social care.
But higher prices and higher taxes will affect lower earners the most. Although NI contributions only going up by 1.25% points for everyone seems fair, as a proportion of income it very much is not because it is a tax on labour that leaves working families much worse off than those who own assets.
The combined effect of increased fuel and food prices, lower Universal Credit and now a hike in taxes will result in many households being pushed into destitution. Our research suggests that we will see a 30 per cent rise in destitution because of the differential impact of inflation upon the poor. However, there are large regional variations, with Northern Ireland projected to have more than twice the average increase.
Given the announcement that the Office for National Statistics are changing the way they report inflation, do we need to change the way we think about price rises?
We certainly need to change the way we calculate these headline economic figures. The trouble is when we aggregate, we end up blunting the story, often at the end of the income distribution spectrum. Take food inflation: a 5 per cent rise in food prices, even if broken down for low-income households, will not show much of an effect. The trouble is that 5 per cent is still too abstract, as it assumes all households purchase the same type of food goods which is implausible.
The food writer and activist Jack Monroe has recorded the price rises for products low-income households are likely to buy, such as own-brand ‘value’ products. Her evidence indicates price increases as high as 344 per cent compared with this time last year. There is clearly a disconnect between these aggregate measures and how they affect people at the household level. The fact that the Office for National Statistics (ONS) have recently recognised this is a good step forward in putting these figures into the context they deserve.
Watch our Winter Economic Forum for more analysis on the UK economy
Related Blog Posts

Child Language Brokering: What It Is and How It Is Experienced By Migrant Families
29 Jan 2024
7 min read

What are the Experiences of Latin American Migrants Accessing Healthcare?
16 Oct 2023
5 min read


Related Projects


Related News

1.2 million UK Households Insolvent This Year as a Direct Result of Higher Mortgage Repayments
22 Jun 2023
2 min read

Thousands Of Households Projected To Face Monthly Mortgage Repayments Greater Than Their Monthly Incomes
03 Nov 2022
2 min read
Related Publications

The Nature of the Inflationary Surprise in Europe and the USA
21 Mar 2024
Discussion Papers

Supporting Immigration Advice Amidst Financial Challenges: Local Authorities’ Funding Initiatives
29 Feb 2024
Topical Briefing

Implications of the Transition from Defined Benefit to Defined Contribution Pensions in the UK
07 Feb 2024
UK Economic Outlook Box Analysis

Exploring Alternative Data Sources for Household Wealth Statistics
24 Jan 2024
Discussion Papers
Related events
Taxing Consumption