An unexpected surge in inflation with more to come
Authors
“A very large increase in headline inflation across most types of consumer expenditure take inflation to its highest level since 2011. And we have more increases to come…”
CPI Inflation rose to 5.1% from the previous months 4.2%, significantly higher than we had expected. There was a small positive effect of 0.15% from the base effect of October-November 2020 dropping out. However, the bulk of the increase was caused by new inflation of 0.74% coming in for October-November 2021. This new inflation is large and there has now been a prolonged and sustained surge in inflation in the last 8 months, with monthly inflation averaging 0.57%, equivalent to an annualised rate of over 7%. The inflation is spread across most types of consumer expenditures.
- The CPI inflation rate was 5.1% in November up from 4.2% in October.
- The NIESR trimmed mean CPI inflation, which captures core inflation and excludes the more extreme price changes, increased to 3.4% from its October figure of 2.1%.
- The high new month on month inflation for October-November of 0.74% brings the six-month average of monthly inflation to 0.53%. This is well above average and would represent an annual inflation rate of almost 6.8% if sustained over twelve months. The eight-month average covering the start of the surge in April 2021 is even higher at 0.57%, an annual inflation rate of almost 6.8% if sustained over twelve months.
- Next month might see a slight respite in inflation as there is a negative effect of -0.26% as the inflation increase from November to December 2020 drops out. However, if the current high level of inflation in recent months continues, then inflation will continue to increase in December, by about 0.3%. The peak in inflation looks set to come in April 2022, which could be as high as 6%.
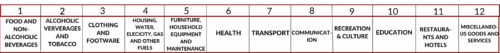
- Looking at different types of expenditure, the main contributors to the overall change in headline inflation were spread widely across expenditures of households:
- Clothing and Footwear 0.28%
- Transport 0.24% (particularly impacted by rising energy prices)
- Food and Non-alcoholic Beverages 14%
- Alcohol and Tobacco 0.13% (mainly the effect of the rise in Tobacco duty announced in the Budget).
- Recreation and Culture 0.11%
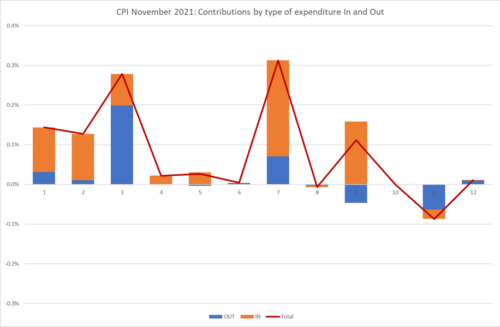
The contribution of each type of expenditure to the overall change in headline inflation is measured by the sum of the monthly inflation “dropping in” and “dropping out” for the type of expenditure multiplied by the weight of the expenditure type in the CPI index. The dropping in reflects the current month’s new inflation, and the dropping out the inflation from October-November 2020.
In Figure 1 we see for all twelve COICOP expenditure categories used in CPI the dropping in shaded light pink and the dropping out shaded light blue, with the total given by the burgundy line. In the cases of Food & Non-Alcoholic Beverages, Alcohol and Tobacco, Clothing & Footwear and Transport, the dropping in and out reinforced each other. The only category of expenditure to contribute a significant negative contribution was Restaurants and Hotels, where again the dropping in and out reinforced each other.
Figure 1: contributions to the increase in inflation by type of expenditure (COICOP division).
Extreme Items.
Out of over 700 types of goods and services sampled by the ONS, there is a great diversity in how their prices behave. Each month some go up, and some go down. Looking at the extremes, for this month, the t ten items with the highest monthly inflation are:
| Table 1:Top ten items for month-on-month inflation (%), November 2021 | |
| COMPUTER GAME DOWNLOADS | 31.47 |
| STRAWBERRIES PER KG OR PUNNET | 29.30 |
| SMART SPEAKER | 26.36 |
| COMPUTER GAME 2 | 17.31 |
| EURO TUNNEL FARES | 15.28 |
| MUSIC DOWNLOADS | 13.31 |
| FRUIT/VEG SMOOTHIE | 11.41 |
| LIVE MUSIC | 10.13 |
| COMPUTER GAME 3 | 9.80 |
| HOUSEHOLD CLEANER CREAM/LIQUID | 9.47 |
The ten items with the highest negative inflation this month are shown in Table 2.
Table 2: Bottom ten items for mom inflation (%), November 2021
| ELECTRIC KETTLE – 1.5-1.7L | -8.53 |
| DIGITAL MEDIA PLAYER | -8.65 |
| SMARTWATCH | -8.69 |
| BABY WIPES 50-85 | -9.67 |
| WHISKY (PER NIP) SPECIFY ML | -9.80 |
| CD ALBUM (TOP 40) | -10.23 |
| CREAM LIQUER 70CL-1LT 14-20% | -10.45 |
| ELECTRIC RAZOR | -10.92 |
| BLU RAY DISC (FILM) FROM CHART | -12.67 |
| EBOOKS | -13.22 |
In both these tables we look at how much the item price-index for this month has increased since the previous month, expressed as a percentage. These calculations were made by my PhD student at Cardiff University, Yang Li.
Looking Ahead.
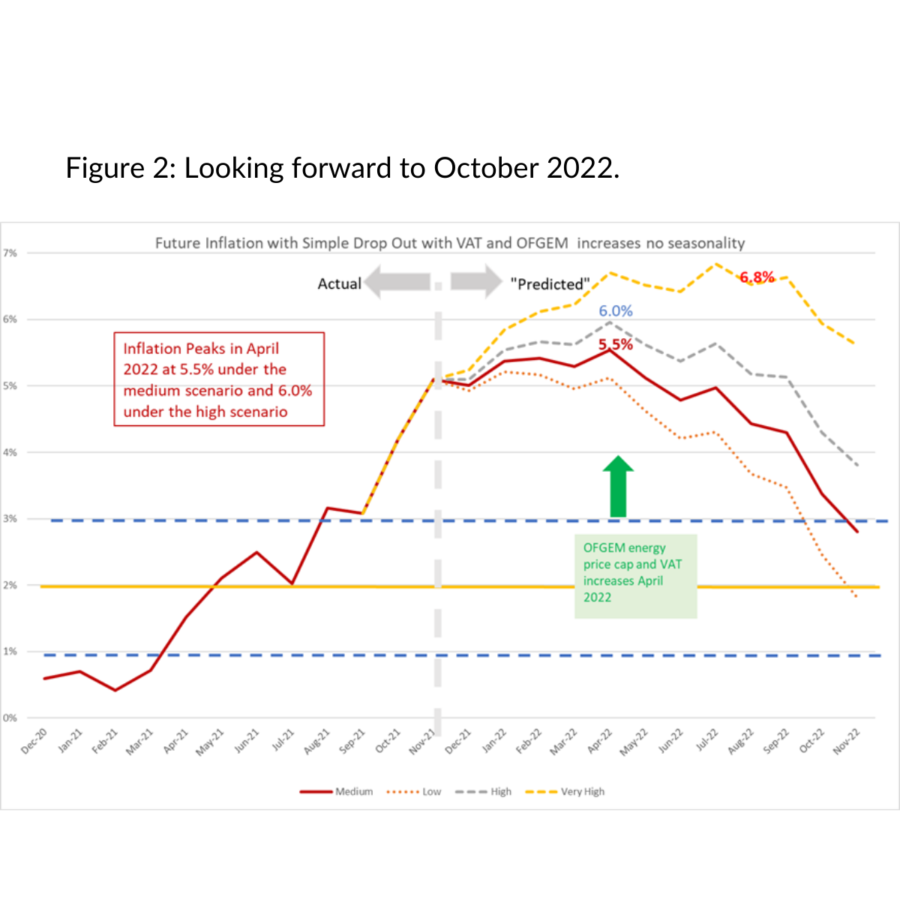
We can look ahead over the next 12 months to see how inflation might evolve as the recent inflation “drops out” as we move forward month by month. Each month, the new inflation enters into the annual figure and the old inflation from the same month in the previous year “drops out”.[1]
We do this under four scenarios.
- The “medium” scenario assumes that the new inflation each month is equivalent to what would give us 2% per annum – 0.17% pcm -(which is both the Bank of England’s target and the long-run average for the last 25 years)
- The “high” scenario assumes that the new inflation each month is equivalent to 3% per annum (0.25% pcm)
- The “low” scenario equivalent to 1% per annum – (0.08% pcm).
- The “very high” scenario equivalent to 5% per annum – (0.4% pcm). This reflects the inflationary experience of the UK in 1988-1992 (when mean inflation was 0.45%) or recent US experience. It also reflects the continuation of the current UK average in recent months UK. This level of mom inflation would indicate a significant break from the historic behaviour of inflation from 1993-2020.
We have added the “Very High” scenario to reflect the view that is becoming more widespread that inflation may be taking off from recent historic norms.
In addition, we also have additional “drop ins” resulting from government policy:
- The reversal of the July 2020 reduction of VAT to only 5% for hospitality, hotel and holiday accommodation and admission to certain attractions. The first increase in VAT from this source was 5% at the end of September 2021, which appeared in the October 2021 inflation figures. The next increase of 7.5% is scheduled for the end of March 2022 which will show up in the April 2022 inflation headline. Using the relevant CPI weights, if all the increase were to be passed on, the impact on headline inflation could be over 0.5%. However in September the impact appears to have been extremely modest resulting in a contribution of only 0.1%. The retailers absorbed most of the increase. However, there is a risk that the increase will feed through with a lag, for example, when price lists are changed. In our forecast, we assume that the impact will be higher in April 2022 at 0.3%.
OFGEM. The increase in the energy price-cap from the end of September showed up in the October inflation figures. There will be another increase to the price-cap in April 2022. Whilst OFGEM will announce the exact figure for this nearer
[1] This analysis makes the approximation that the annual inflation rate equals the sum of the twelve month-on-month inflation rates. This approximation ignores “compounding” and is only valid when the inflation rates are low. At current levels of inflation, the approximation works well, being accurate to within one decimal place of percentage annual inflation. the time, given the behaviour of energy prices in recent months the increase is likely to be of a similar size to the most recent one. Hence, we have added in an additional “drop in” inflation of 0.4% for April 2022.
[1] This analysis makes the approximation that the annual inflation rate equals the sum of the twelve month-on-month inflation rates. This approximation ignores “compounding” and is only valid when the inflation rates are low. At current levels of inflation, the approximation works well, being accurate to within one decimal place of percentage annual inflation.
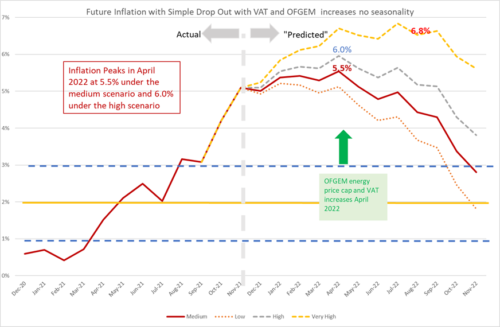
The patterns of the medium and high projections are similar, with a peak in April 2022 of 65.5% in the medium scenario and 6.0% in the high. After the April peak, inflation heads down and drops to 2.8% in the medium scenario by October 2022. This means that the inflation will remain well above the Bank of England’s target of 2% for some time to come (18-24 months) even if the underlying inflation remains at its historic average as in the medium scenario. In other words, Inflation will remain above 3% for at least 12 months. However, currently monthly inflation is running hotter than the historic average, and if this continues it will delay the reversion to the historic mean.
In the very high inflation scenario, inflation heads up to over 6% by April 2022 and remains there until October 2022. If the supply chain and energy issues persist or get worse, this is the sort of inflationary trajectory we might see. If this trajectory materialised, it would imply a complete failure of the Bank of England’s inflation targeting policy and inflationary expectations would almost certainly move away from their historic 2% anchor. However, even under the medium and high scenarios, the behaviour of inflation will pose a challenge for the Bank’s credibility.
Figure 2: Looking forward to October 2022.
For further analysis of current and future prospects for inflation in the UK see:
Will Inflation take off in the UK? The Economics Observatory.
UK Economic Outlook Autumn 2021: Recovery: Stalling not Soaring
Related Blog Posts


Related Projects


Related News


Why it’s not worth worrying that the UK has technically entered a recession
26 Feb 2024
4 min read

1.2 million UK Households Insolvent This Year as a Direct Result of Higher Mortgage Repayments
22 Jun 2023
2 min read

The Key Steps to Ensuring Normal Service is Quickly Resumed in the Economy
13 Feb 2023
4 min read
Related Publications

Recessionary Pressures Receding in the Rearview Mirror as UK Economy Gains Momentum
12 Apr 2024
GDP Trackers
Related events

Summer 2023 Economic Forum

Spring 2023 Economic Forum

Winter 2023 Economic Forum

Autumn 2022 Economic Forum

Summer 2022 Economic Forum

Spring 2022 Economic Forum

Winter 2022 Economic Forum
