US long-run unemployment reaches lowest point since at least 1949
The natural rate of unemployment of the US economy has reached a lowest point since at least 1949. How can we explain such an achievement? And does it matter? In this blog post, I will explain what we mean by the natural rate of unemployment, give two explanations for its secular decline, and present one challenge ahead.
Authors
The natural rate of unemployment of the US economy has reached a lowest point since at least 1949. How can we explain such an achievement? And does it matter? In this blog post, I will explain what we mean by the natural rate of unemployment, give two explanations for its secular decline, and present one challenge ahead.
1.Different measures of the natural rate of unemployment point down
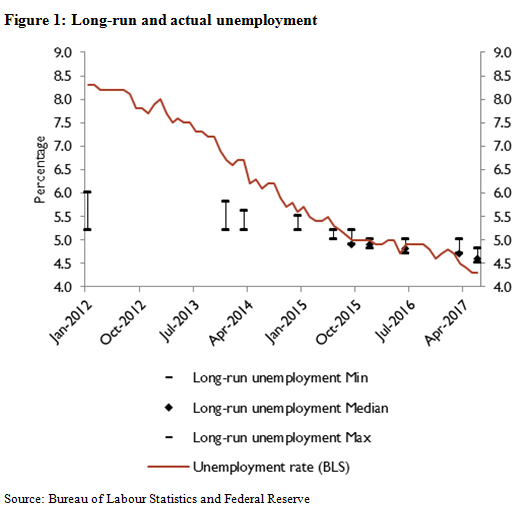
At its June 13-14 meeting, the Federal Reserve Board’s Open Market Committee (FOMC) decreased its median estimate of the long-term unemployment rate from 4.7 to 4.6 per cent. This is the latest in a number of downward revisions of the FOMC’s estimate of normal unemployment over the past five years, which have amounted to about 1 percentage point in total (figure 1). According to the Fed’s publication, long-term unemployment rate is defined as the “unemployment rate that a policymaker expects the economy to converge over time – maybe in five or six years – in the absence of further shocks and under appropriate monetary policy.” The range of the FOMC members’ projections of long-term unemployment, excluding the three highest and three lowest projections, was 4.5 to 4.8 per cent.
An alternative measure of the natural rate unemployment is the non-accelerating inflation rate of unemployment (NAIRU), which measures the unemployment rate consistent with stable inflation. The two measures are closely related, because one would expect inflation to be stable in the long-run. (How are the two measures different? See here.) The Congressional Budget Office estimates that the NAIRU has reached 4.74 per cent (figure 2), which is the lowest level since at least 1949.
2.Slack in the labour market
It is not only natural unemployment that has declined. Actual unemployment has been following the same downward trend during the last five years, albeit with a steeper slope (figure 1). Actual unemployment now stands at 4.3 per cent of the labour force, the lowest in 16 years, and even 0.3 per cent points lower than the natural unemployment rate. As immediately available workers become scarcer, one could expect that wage bargaining between firms and employees would tilt in favour of the employees, leading to higher wages. Yet wage increases have remained subdued, at about 2.4 per cent. Furthermore, Personal Consumption Expenditure (PCE) inflation remains below the Fed’s objective at 1.7 per cent for the headline rate and 1.5 per cent for the core rate. The absence of wage pressures justifies ex-post revising down the natural rate of unemployment. But it also begs the question why is the natural unemployment rate going down?
3.Two structural factors: demographics and volatility
Since the 1950s, natural unemployment has largely followed a hump-shape, first increasing from 5.3 to 6.3 per cent in 1978, and then decreasing, with the exception of a slight increase in the aftermath of the financial crisis in 2009-2011 (figure 2). I will present two factors explaining this behaviour. According to Ball and Mankiw (2002), one factor is demographics. Unemployment rates tend to be heterogeneous for different age groups. For example, unemployment rate in the 16-24 age group is generally higher than in other age groups because it is difficult for young people without any professional experience to find a first job. As a consequence, a shift of the age structure of the population, for example as a result of the baby boom, can modify the natural rate of unemployment. Econometric evidence shows that, even though the baby boom story fits a hump-shaped movement in the NAIRU, it can only explain part of it.
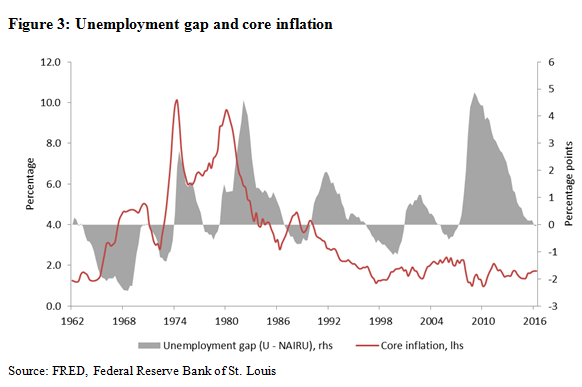
According to Begnino et al (2015), another factor is macroeconomic volatility. It is an empirical fact that wages have asymmetric rigidities in that they often go up but rarely go down. Employees often behave as though they will do whatever they can to avoid a pay-cut. Faced with this constraint, employers choose to hire less than the optimal number of employees when faced with economic uncertainty. Hence an increase in macroeconomic volatility, which is a proxy for uncertainty, can be expected to lead to higher unemployment in equilibrium. Looking at figure 2, the NAIRU increased from the 60s to the late 70s when GDP growth volatility was high and increasing, and declined during the Great Moderation when GDP growth volatility were more subdued, supporting the theory. Currently, 2 years GDP growth volatility is at a historically low level, which is consistent with a lowering of the NAIRU.
.PNG)
4.Looking forward
Having achieved both its mandates of low inflation and full employment, should the Fed declare mission accomplished and rest on its laurels? Of course not! As can be seen in figure 3, the natural unemployment rate does not act as a lower bound to unemployment, and the US economy has regularly undershot this objective. A further decline in unemployment could put pressure on wage inflation and subsequently on price inflation. In this scenario, the Fed would be forced to tighten monetary conditions further in order to achieve its price stability objective.
The author would like to thank Jagjit Chadha, Graham Hacche and Amit Kara for helpful suggestions and comments.
Related Blog Posts


Related Projects


Related News
Call for Papers: Lessons From Quantitative Easing & Quantitative Tightening
09 Feb 2024
1 min read

Related Publications

Inflation Differentials Among European Monetary Union Countries: An Empirical Evaluation With Structural Breaks
20 Nov 2023
National Institute Economic Review

The Macroeconomic Effects of Re-applying the EU Fiscal Rules
20 Nov 2023
National Institute Economic Review

Another Look at a Sensible Fiscal Policy for the Sharp Rise in Government Debt
20 Nov 2023
National Institute Economic Review
Monetary Policy: Prices versus Quantities
20 Nov 2023
National Institute Economic Review
Related events
Assessing Cycles and Structural Changes in Markets

Business Conditions Forum