Weakness in wage growth: what is driving it?
Real wages are currently growing considerably below the pre-crisis average in many advanced economies. This is particularly striking especially against a backdrop of tight labour markets across a number of G7 economies, leading many economists to question the well-known relationship between unemployment and wage growth that is embodied in the wage-Phillips curve. Take the UK as an example, why is wage growth so low with the unemployment rate at a 40 year low of 4.2 per cent? Back in 1975, when the unemployment rate was at similar levels, wage growth was above 30 percent in nominal terms.

Authors
Real wages are currently growing considerably below the pre-crisis average in many advanced economies. This is particularly striking especially against a backdrop of tight labour markets across a number of G7 economies, leading many economists to question the well-known relationship between unemployment and wage growth that is embodied in the wage-Phillips curve. Take the UK as an example, why is wage growth so low with the unemployment rate at a 40 year low of 4.2 per cent? Back in 1975, when the unemployment rate was at similar levels, wage growth was above 30 percent in nominal terms.
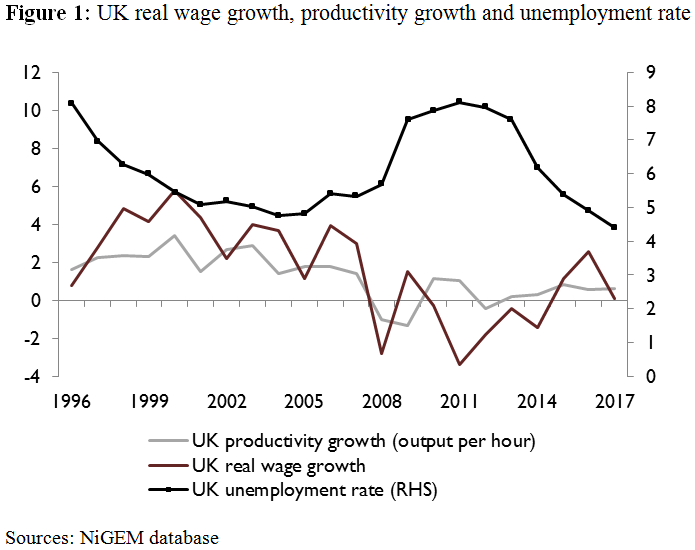
The relationship between real or inflation-adjusted wages and productivity and the unemployment rate for the UK is summarised in Figure 1 below.
This seeming disconnect between wages and unemployment has led many to question the efficacy of the standard wage-Phillips curve and to therefore look for alternative explanations. In this blog we explore and test a number of plausible explanations and find that productivity growth is an important explanatory variable for wage dynamics in the G7.
This should not come as a surprise because economic theory tells us that in equilibrium, the real wage rate is equal to the marginal product of labour – that is, how much additional output a worker produces per hour.
We also consider the role of inflation. Specifically, inflation expectations enter into workers’ wage bargaining as prices determine real disposable income: the persistence of ‘lowflation’ means that price pressures have not increased wages materially.
We test all these competing explanations, augmenting the standard wage-Phillips curve and carrying out the panel estimation for the G7 economies together (see Table).
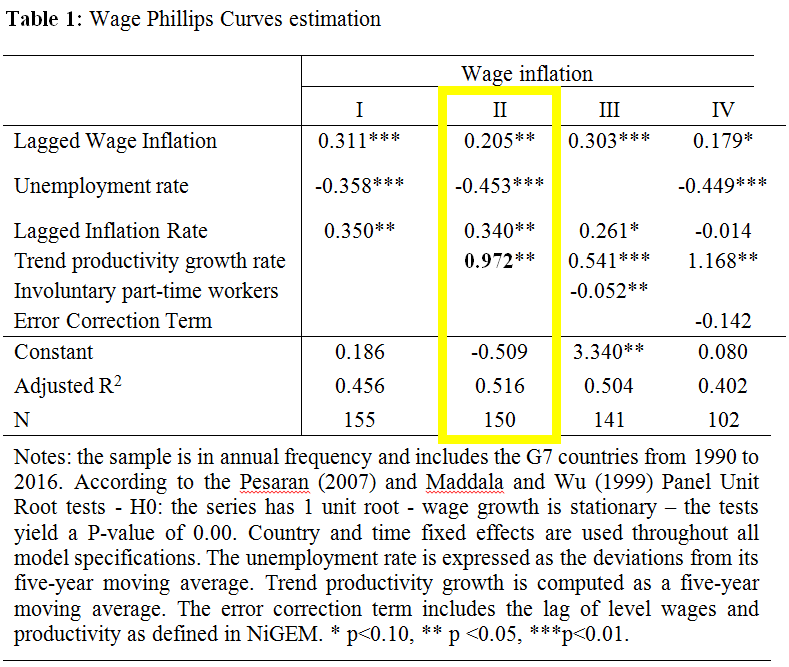
Using the coefficients from our preferred model with productivity (specification II), we find that productivity growth helps explain around 50 per cent of the growth in nominal wages in the G7. Inflation expectations determine some 20 per cent, while the unemployment rate around 10 per cent, while the rest is explained by a delayed adjustment of current wages to the shocks in the previous period. In other words, productivity is a key driver of wage growth in the G7.
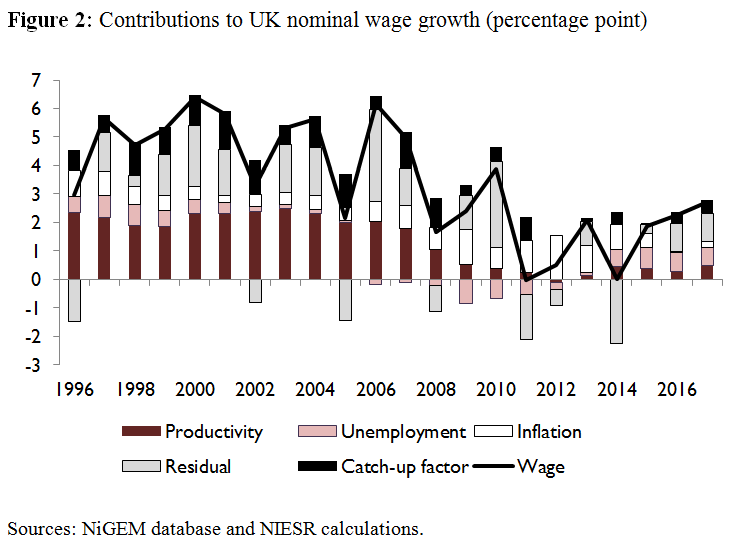
The results for the UK are similar. Figure 2 shows the evolution of the recent wage dynamics in the UK and of their drivers. Productivity was the key determinant of wage growth up until 2007, while the lack of firm productivity growth post-crisis explains half of the fall we have seen in wage growth over the past ten years. Unemployment dragged wage growth lower from 2008 until 2010 and has in turn been contributing positively to it over the past five years. The negative residuals in the years from 2010 are likely due to the cap on public sector wages introduced that year. Recent NIESR research has estimated that public sector wages had fallen more than 3 per cent below their equilibrium level in 2016-2017.
Looking ahead, according to our latest forecasts published in our May Review, we expect a gentle rise in nominal wages in line with a productivity growth of around 1.5 per cent. In turn, the unemployment rate should stabilise at a slightly higher level, subtracting somewhat from wage growth.
Related Blog Posts


What Are the Implications of the Rising National Minimum Wage and National Living Wage Rates?
19 Mar 2024
5 min read


Related Projects


Related News

Press Release: Compositional effects push up average weekly earnings at the end of 2020
26 Jan 2021
2 min read
Press Release: 2020 shaping up to be the worst year for total pay growth since 2009
15 Dec 2020
2 min read
Related Publications

Pay-Setting Among Employers in the Agriculture, Cleaning, Hospitality and Retail Sectors
11 Mar 2024
Research Report

Job Boom or Job Bust? The Effect of the Pandemic on Actual and Measured Job and Employment Growth
07 Feb 2024
UK Economic Outlook Box Analysis

Kurzarbeit/Short Time Working: Experiences and Lessons from the Covid-Induced Downturn
20 Nov 2023
National Institute Economic Review

Related events
