What to expect from inflation throughout 2022 and beyond
Authors

CPI rose to 5.5% in January from 5.4% in December. Month on month inflation between December and January was slightly negative at -0.1% due to the usual sales after Christmas. However, the new year drop is smaller than usual, in particular for clothing and footwear.
There is a mixed story across the different types of expenditure. Household energy prices and rentals rose significantly from December to January, as did Food and Non-Alcoholic Beverages. However, there were falls elsewhere month on month, including Transport and Recreation and Culture. The overall increase in headline inflation was actually only 0.05%, which due to rounding appears as 0.1% (CPI is reported to one decimal pace).
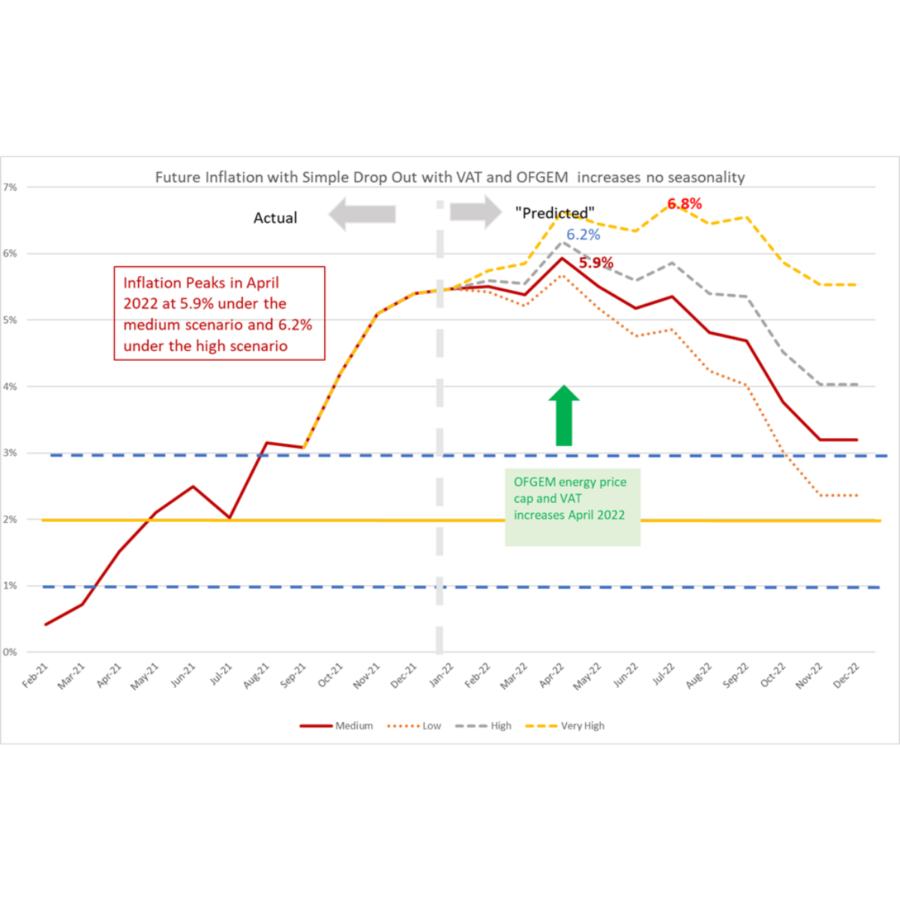
Overall, the figures out today have lowered the future projected path of inflation over the next 12 months as the general surge in prices appears to have abated, at least for January. The February figure will be crucial to see if this carries on or the surge picks up again due to continuing supply chain and labour shortage issues. However, inflation is still expected to rise to around 6%, although this peak may be reduced in the official figures if the rebates are included, and will remain high throughout 2022 and still well above 2% throughout 2023.
The continued rise in inflation is a result of future price increases already built in, most significantly, rises in domestic energy as the OFGEM price cap will be increased in April 2022. Whilst the exact increase has been announced, the way the ONS will deal with the government subsidy to households has not. We will find out when the February inflation figures are published. If the full price increase is included in the inflation measure then it will be about 0.7%; but it will be less if the subsidy is treated like a change in indirect tax. In addition, there is the second increase in VAT on hospitality scheduled for April. However, the impact of this on inflation depends crucially on how much is passed on by hospitality providers and this is hard to predict. Geopolitics may also intervene, and if conflict breaks out in either the Ukraine or the South China Sea, we can expect to see energy prices go even higher and supply chains come under much more pressure.
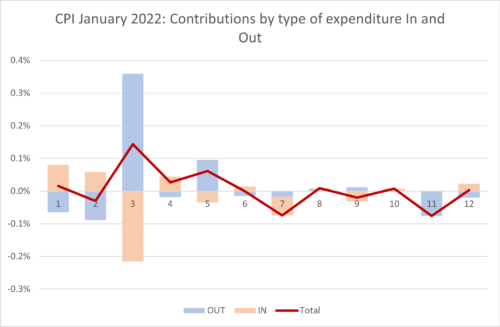
Looking at the contributions of the different sectors to overall inflation we can look at the old inflation dropping out of the annual figure (Dec 2019-Jan 2021) and the new monthly inflation dropping in (Dec 2020-Jan 2022) and use the expenditure weights to calculate CPI. In the chart below, we show the “dropping out” in blue and the “dropping in” in light brown. The overall effect is the sum of the two and is shown as the burgundy line.
Clothing and footwear had the largest effect overall. This was because the sales of last year (which dropped out) were much bigger than the sales this year (which dropped in). The overall contribution was 0.14 percentage points reflecting the weaker than usual sales. However, for Food and Non-Alcoholic Beverages the drop outs and drop ins were opposite in sign, as was the case in 7 out of the 12 types of expenditure. For Transport and Restaurants the two effects both had a negative effect, whilst for hotels the positive dropping out was tiny compared to the negative dropping in.

Extreme Items.
Out of over 700 types of goods and services sampled by the ONS, there is a great diversity in how their prices behave. Each month some go up, and some go down. Looking at the extremes, for this month, the top ten items with the highest monthly inflation are:
| Table 1:Top ten items for month-on-month inflation (%), January 2022 | |
| CREAM LIQUER 70CL-1LT 14-20% | 30.18 |
| ACTION CAMERA | 26.51 |
| MUSIC DOWNLOADS | 18.98 |
| HOUSE CONTENTS INSURANCE | 17.45 |
| TOOTHBRUSH | 15.73 |
| DWELLING INSURANCE | 14.24 |
| ELECTRIC RAZOR | 13.90 |
| PRIVATE HEALTH CARE 1 | 13.90 |
| PRIVATE HEALTH CARE 3 | 13.90 |
| CARTON/BOX OF CHOCS 150-400GM | 13.52 |
The ten items with the highest negative inflation this month are shown in Table 2.
| Table 2: Bottom ten items for mom inflation (%), January 2022 | |
| GOLF GREEN FEES | -15.36 |
| FRUIT DRINK BOTTLE 4-8 PACK | -16.72 |
| COMPUTER GAME 3 | -17.24 |
| COMPUTER GAME 2 | -19.37 |
| COACH FARES | -19.96 |
| EURO TUNNEL FARES | -20.97 |
| SRVYRS FEES MORTGAGE VALUATION | -22.95 |
| CDS- PURCH OVER INTERNET | -24.51 |
| INTERNET COMPUTER GAMES | -25.10 |
| AIR FARES | -29.10 |
In both these tables we look at how much the item price-index for this month has increased since the previous month, expressed as a percentage. These calculations were made by my PhD student at Cardiff University, Yang Li.
Looking Ahead.
We can look ahead over the next 12 months to see how inflation might evolve as the recent inflation “drops out” as we move forward month by month. Each month, the new inflation enters into the annual figure and the old inflation from the same month in the previous year “drops out”.[1]
We do this under four scenarios.
- The “medium” scenario assumes that the new inflation each month is equivalent to what would give us 2% per annum – 0.17% pcm – which is both the Bank of England’s target and the long-run average for the last 25 years.
[1] This analysis makes the approximation that the annual inflation rate equals the sum of the twelve month-on-month inflation rates. This approximation ignores “compounding” and is only valid when the inflation rates are low. At current levels of inflation, the approximation works well, being accurate to within one decimal place of percentage annual inflation.
- The “high” scenario assumes that the new inflation each month is equivalent to 3% per annum (0.25% pcm)
- The “low” scenario assumes that the new inflation each month is equivalent to 1% per annum (0.08% pcm).
- The “very high” scenario assumes that the new inflation each month is equivalent to 5% per annum (0.4% pcm). This reflects the inflationary experience of the UK in 1988-1992 (when mean inflation was 0.45%) or recent US experience. It also reflects the continuation of the current UK average in recent months. This level of month-on-month inflation would indicate a significant break from the historic behaviour of inflation from 1993-2020.
We added the “Very High” scenario a few months ago to reflect the view that is becoming more widespread that inflation may be taking off from recent historic norms. However, if the future behaviour of inflation is the same as the last 9 months, even the “very high” scenario will seem a conservative underestimate.
In addition, we also have additional “drop ins” resulting from government policy:
- The reversal of the July 2020 reduction of VAT to only 5% for hospitality, hotel and holiday accommodation and admission to certain attractions. The first increase in VAT from this source was 7.5% at the end of September 2021, which appeared in the October 2021 inflation figures. The next increase of 7.5% is scheduled for the end of March 2022 which will show up in the April 2022 inflation headline. Using the relevant CPI weights, if all the increase were to be passed on, the impact on headline inflation could be over 0.5%. However in September the impact appears to have been extremely modest resulting in a contribution of only 0.1%. The retailers absorbed most of the increase. However, there is a risk that the increase will feed through with a lag, for example, when price lists are changed. In our forecast, we assume that the impact will be higher in April 2022 at 0.3%.
- The increase in the energy price-cap from the end of September showed up in the October inflation figures. There will be another increase to the price-cap in April 2022. Given the increase announced earlier this month, we would predict an increase of 0.6-0.7%. However, the impact on the official figures will depend on exactly how the ONS will treat this change, which they will announce next month.
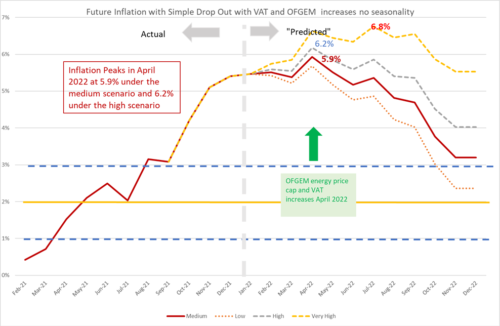
The patterns of the medium and high projections are similar, with a peak in April 2022 of 5.9% in the medium scenario and 6.2% in the high. After the April peak, inflation heads down and by November 2022 drops to 3.2% in the medium scenario and 4% in the high scenario. This means that inflation will remain well above the Bank of England’s target of 2% for some time to come even if underlying inflation remains at its historic average as in the medium scenario. In other words, Inflation will remain above 3% for at least 12 months. However, if monthly inflation is running hotter than the historic average, and if this continues it will delay the reversion to the historic mean well into 2023.
In the very high inflation scenario, inflation heads up to almost 7% by April 2022 and remains there until October 2022. If the supply chain and energy issues persist or get worse, this is the sort of inflationary trajectory we might see.
Figure 2: Looking forward to December 2022.
Will Inflation take off in the UK? The Economics Observatory.
https://www.niesr.ac.uk/publications/powering-down-not-levelling-up?type=uk-economic-outlook
Related Blog Posts


Related Projects


Related News


Why it’s not worth worrying that the UK has technically entered a recession
26 Feb 2024
4 min read

1.2 million UK Households Insolvent This Year as a Direct Result of Higher Mortgage Repayments
22 Jun 2023
2 min read
Related Publications

Recessionary Pressures Receding in the Rearview Mirror as UK Economy Gains Momentum
12 Apr 2024
GDP Trackers
Related events

Summer 2023 Economic Forum

Spring 2023 Economic Forum

Winter 2023 Economic Forum

Autumn 2022 Economic Forum

Summer 2022 Economic Forum

Spring 2022 Economic Forum

Winter 2022 Economic Forum
