What Is ‘Inflation’?
On Wednesday, the Office for National Statistics will publish a figure for the annual rate of inflation in November. But what is inflation and why should we be concerned about how high it is currently? Our Associate Economist, Paula Bejarano Carbo, discusses these questions with our Deputy Director for Macroeconomic Modelling and Forecasting, Stephen Millard.
Authors
What is inflation and how is it calculated?
Inflation is an economic term used to describe rising prices. The inflation rate tells us the extent to which prices are rising. Take a simple example: if a food shop cost £100 last month, but the same food shop costs £110 this month, we would say that there is inflation (the price of food has gone up relative to last month) and the monthly inflation rate is 10 per cent (as £10 is 10 per cent of £100, and you now need to pay £10 more for the same amount of food). This is why we relate inflation to the cost of living: in the example, the consequences of inflation involve either paying more for the same amount of food or having to buy less food for £100, relative to last month. If a particular shoppers’ wages haven’t risen enough to counter these consequences, it’s clear that the shopper is going to be worse off (from either spending more or eating less). Economists call incomes which are adjusted to reflect the current rate of inflation ‘real incomes’ – this term can help us capture the fact that if wages fail to match price rises, households are materially worse off as their real income has fallen.
The inflation rate in the UK is measured and calculated by the Office of National Statistics (ONS), the government department in charge of collecting and analysing statistics (like inflation). The ONS is independent of ministers and follows a set of standards called ‘data principles’ to ensure it provides good quality and trustworthy statistics.
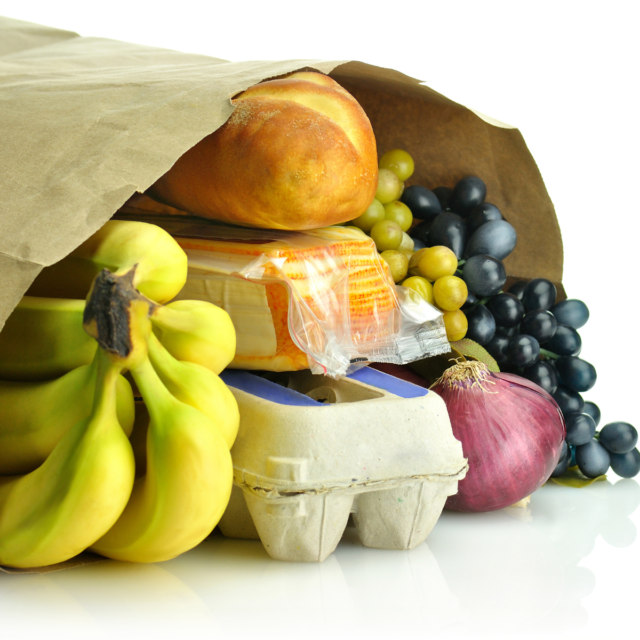
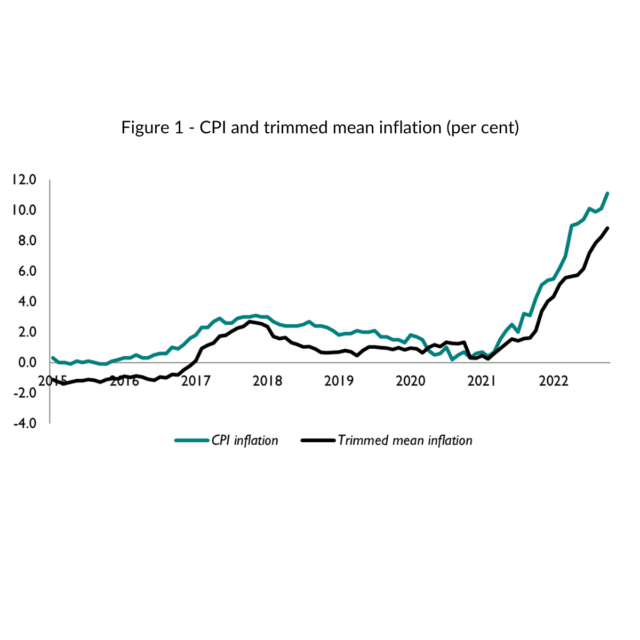
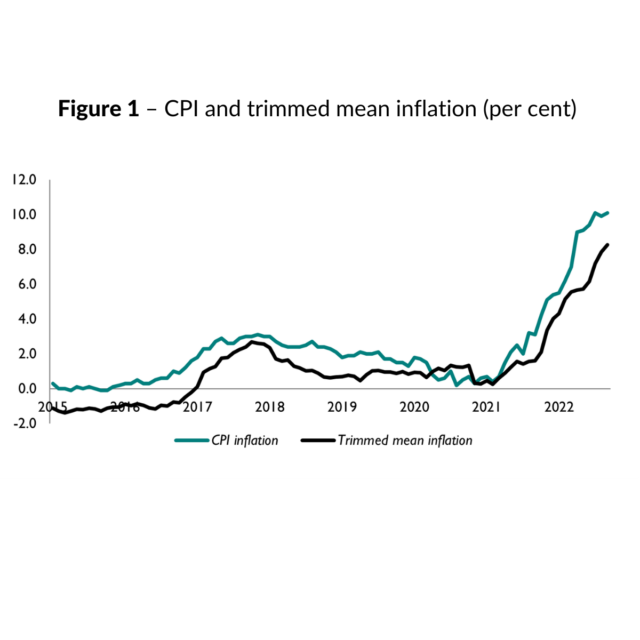
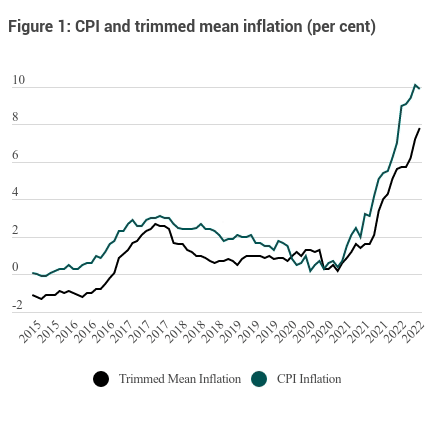
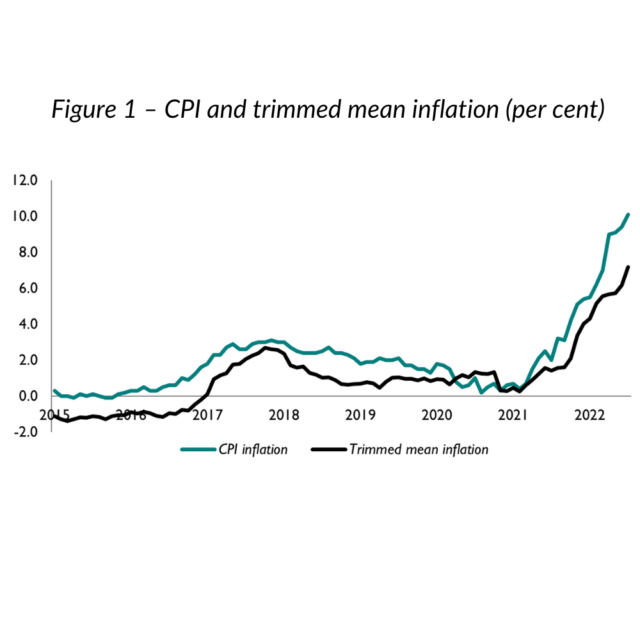
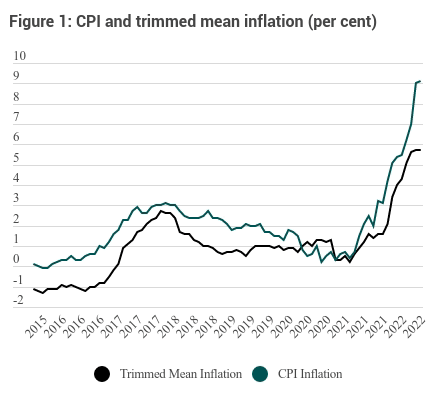
The ONS produces a particular measure of inflation based on a Consumer Price Index (CPI). CPI inflation is a measure that tries to capture how quickly the prices of goods and services bought by households are rising. The ONS calculates CPI inflation by collecting data on over 700 items that an average family in the UK might buy. This ‘basket’ of 700 goods contains items an average household might buy day-to-day, like bananas, cinema tickets, medicine, electricity, and a pint of beer at a pub, as well as durable goods like personal computers or bicycles. The ONS employs price collectors to visit or ring shops and collect over 100,000 prices of these 700 goods (as they collect multiple prices for each item, i.e. the price of bananas at different shops all over the UK) and then statisticians at the ONS calculate the average change in prices across this basket. Note that the basket is weighted to represent how much an average family might spend on different categories of items (we might expect, for instance, families to spend more on food than cinema tickets every month, and this is reflected in the composition of the CPI basket.)
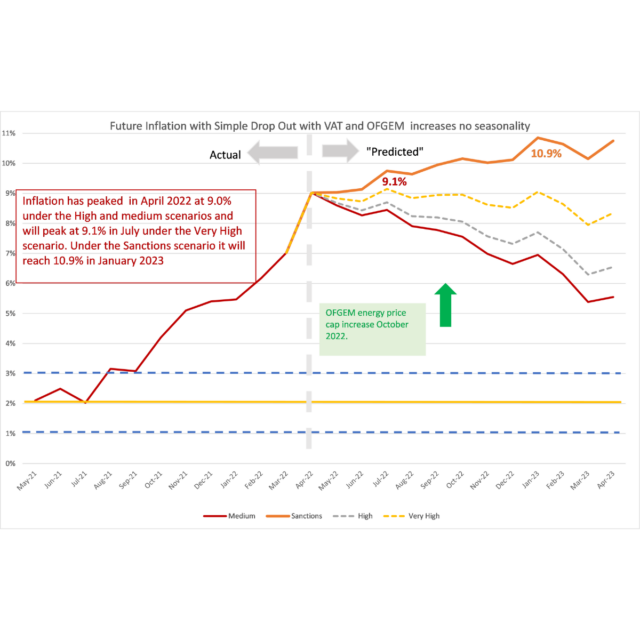
The ONS’s latest data suggests that the annual UK CPI inflation rate in October was 11.1 per cent. This means that the average prices in the CPI basket in October 2022 were 11.1 per cent higher than those in October 2021. You’ll notice that there is a lag here: though it’s December, the latest figure is that of October – this is because it takes a while for the ONS to collect all the data needed to produce an inflation figure.
Lastly, there are different measures of inflation. Another common measure of inflation, for instance, is the Retail Prices Index (RPI) inflation, which measures the average change in prices in a different set of retail goods and services, including mortgage interest payments. RPI inflation is usually around 1 to 2 percentage points higher than CPI inflation because it uses an arithmetic mean rather than a geometric mean to calculate average price rises.
Why do prices rise over time?
In general, prices rise over time as the economy grows. To illustrate simply: as UK businesses grow, there are more jobs, which means more people can afford to buy products, so businesses can raise prices (since they know households can and will pay for them) and thus businesses grow further – and so on. A bit of inflation is thus a natural element of economic growth and isn’t necessarily a bad thing.
ONS data indicates that a kilogram of grapes, for instance, was worth £2.50 in 1990, while by 2021 it was worth £3.92. However, not all prices rise over time. A kilogram of bananas, for instance, was worth £1.14 in 1990 but 80p in 2021. That being said, on average, prices rise moderately as the economy grows.
Why target 2 per cent inflation?
Economists generally believe that a ‘good level’ of inflation is one which is low and stable, as this can enable healthy economic growth. Let’s unpack the ideas of ‘low’ and ‘stable’ separately.
Firstly, it is generally believed that high inflation is undesirable. Many Britons may still remember the extraordinary levels of annual CPI inflation experienced in the country during the 1970s and 1980s – peaking at just over 24 per cent in 1975. Such a level of inflation no doubt caused a lot of harm to many households as it effectively limited their ability to purchase the goods and services they needed if wages and savings couldn’t keep up with this soaring figure. Besides lowering real incomes, there are other costs of inflation for households. For instance, economists sometimes refer to the ‘shoe-leather costs’ of inflation, or the costs associated with trying to protect your money from being eroded by inflation. The name shoe-leather comes from the wear-and-tear shoes may have faced from walking to the bank more frequently than usual. Though digital banking may have reduced the costs of walking to the bank, shoe-leather costs still exist, for instance as time spent re-budgeting or considering ways to invest your cash in inflation-protected savings. Equally, businesses face costs under high inflation, as captured by the idea of ‘menu costs’. These are costs associated with changing prices: for instance, the cost of printing new menus or price tags or the loss of goodwill among customers resulting from frequent price changes. Inflation today is nowhere near the record high of the 1970s, but still, high inflation and the subsequent cost of living crisis is making many UK households materially worse off. Research from our recent Autumn Economic Outlook suggests that, given current inflation levels, 20 per cent of UK households will have little or no savings by April 2024. In the shorter term, many people will need to choose between eating and heating; we expect that 2.5 million people will rely on food banks to get through the winter.
It is important to maintain a stable rate of (low) inflation to prevent uncertainty. Keeping an inflation target enables households and businesses to plan ahead and have a clear idea of what prices they will be facing in the future. To elaborate: if households have no idea what inflation might look like in a few months, they are likely to spend less and save more in case there is an inflation shock. This limits spending, and thus limits growth in the economy.
The Bank of England’s objective, as set by the government, is to keep the inflation rate at 2 per cent. Plainly speaking, this target is suitable because it is not too high and not too low. We’ve seen that high inflation can be harmful. Low inflation (or negative inflation, also known as disinflation) can be undesirable because it limits spending. To explain: if you think prices are going to fall a year from now, you’ll put off buying until then. Clearly, this would also limit growth in the economy.
Why does the official inflation number ‘feel’ different to the price increases you might personally see?
As explained above, the ONS’s inflation rate is just an average. In practice, this means that some households face a higher rate than the ‘headline’ CPI inflation figure. As my colleague Max Mosely wrote earlier this summer, it seems to be the case that the cheapest products in supermarkets – like rice and bread – face much higher price rises than luxury products – like branded ready-meals. It is simple to see that lower-income households – who spend a higher proportion of their incomes on essential food and other items which generally see steeper price rises (like energy), might face higher inflation rates in practice than is indicated by the ONS’s estimate.
Overall, it can be concluded that the ONS’s figure does not capture the fact that there are significant differences among the prices that households face, and further, that households of different incomes might have different ‘basket’ compositions.
Related Blog Posts

Related Projects


Related News
Call for Papers: Lessons From Quantitative Easing & Quantitative Tightening
09 Feb 2024
1 min read

Related Publications
Difficult Challenges Ahead for MPC with Underlying inflation in the UK Hitting Record High
19 Oct 2022
CPI Trackers
Although the Latest Fall in UK Inflation in August to 9.9 per cent Looks Positive, Underlying Inflation Still Remains at Record High Levels
14 Sep 2022
CPI Trackers
No Respite For UK Consumers As UK Inflation Surges To 10.1 Per Cent
17 Aug 2022
CPI Trackers
Underlying Inflation in the UK Rises to 6.2 Per Cent, the Highest Since January 1992!
20 Jul 2022
CPI Trackers
UK Inflation Marginally Increased to 9.1 per cent in May, Predominately Due to Surging Food Prices
22 Jun 2022
CPI Trackers
UK inflation in April surged to 9 per cent, marking the highest monthly increase since the 1980s
18 May 2022
CPI Trackers

No respite for UK consumers and the Bank of England as inflation hits 7 per cent
13 Apr 2022
CPI Trackers
Related events
Assessing Cycles and Structural Changes in Markets

Business Conditions Forum