What next after the largest month on month rise in the CPI since April 1993
Authors
CPI Inflation rose to 4.2% from the previous months 3.1%, slightly higher than we had expected. The anticipated twin effects of the increase in the OFGEM price cap and an increase in the VAT rate on hospitality (partially reversing the July 2020 reduction) both impacted the figure as did surging petrol and diesel prices. Since there was a base effect of 0% dropping out from September 2020, all the change in headline inflation in October arises from the new inflation in the month September to October 2021 which represents the largest month on month increase since April 1993. The increase of 1.1% in annual inflation from 3.1% to 4.2% was almost as large as the recent increase in August, which was the largest in over a decade.
- The CPI inflation rate was 4.2% in October up from 3.1% in September. All this increase was due to new month on month inflation dropping in (September-October 2021). About 0.7% of this was due to the increases in the OFGEM price cap and the increase in VAT in the hospitality sector.
- The NIESR trimmed mean CPI inflation, which captures core inflation and excludes the more extreme price changes, increased to 2.1% from its August figure of 1.6%.
- The very high new month on month inflation for September-October of 1.1% was the largest since April 1993, which brings the six-month average of monthly inflation to 0.53%. This is well above average and would represent an annual inflation rate of almost 6.5% if sustained over twelve months.
- Next month will see a further increase in headline inflation of 0.3% or more through a combination of a base effect of 0.15% as the decrease of October-November 2020 drops out and the new inflation for October-November 2021 enters the Headline.
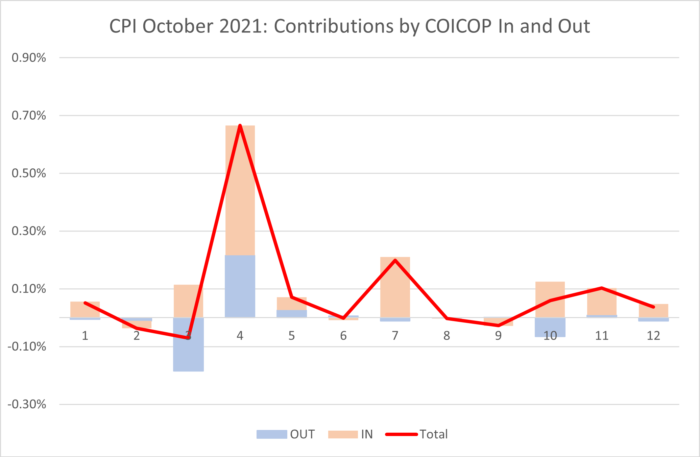
- Looking at different types of expenditure, the main contributors to the change in headline inflation were those most impacted by rising energy costs and the increase in VAT
- HousingWater, electricity gas and other fuels 0.7%
- Transport 0.2%
- Restaurants and Hotels 0.1%
The contribution of each type of expenditure is measured by the sum of the monthly inflation “dropping in” and “dropping out” for the type of expenditure multiplied by the weight of the expenditure type in the CPI index. The dropping in reflects the current month’s new inflation, and the dropping out the inflation from September-October 2020.
In Figure 1 we see for all twelve COICOP expenditure categories used in CPI the dropping in shaded light pink and the dropping out shaded light blue, with the total given by the burgundy line. In the case of both Housing Water, electricity gas & other fuels and Restaurants & Hotels , the dropping in and out reinforced each other. Transport was affected by the surging fuel prices. In Clothing & Footwear, the new and the old inflation worked in opposite directions, but overall there was a slight decrease. In Food & Non-alcoholic Beverages showed an increase overall whilst Alcohol and Tobacco registered a slight decrease. For Education, the new inflation was greater than the old with a net contribution of 0.06% to y-o-y inflation. The overall contribution of 9 out of the 12 different types of expenditure was positive, indicating a widespread impact of inflation showing through.
Figure 1: contributions to the increase in inflation by type of expenditure (COICOP division).

Extreme Items
Out of over 700 types of goods and services sampled by the ONS, there is a great diversity in how their prices behave. Each month some go up, and some go down. Looking at the extremes, for this month, the t ten items with the highest monthly inflation are:
| Table 1:Top ten items for month-on-month inflation (%), October 2021 | |
| INTERNET COMPUTER GAMES | 31.06 |
| KEROSENE – 1000L DELIVERED | 18.74 |
| ELECTRIC TOOTHBRUSH | 18.53 |
| GAS | 17.58 |
| EURO TUNNEL FARES | 16.36 |
| ELECTRIC KETTLE – 1.5-1.7L | 13.47 |
| SHOWER GEL 150-250ML | 12.25 |
| ELECTRIC RAZOR | 11.85 |
| COMPUTER GAME 3 | 10.85 |
| BLU RAY DISC (FILM) FROM CHART | 10.71 |
The ten items with the highest negative inflation this month are shown in Table 2.
| Table 2: Bottom ten items for mom inflation (%), October 2021 | |
| SRVYRS FEES MORTGAGE VALUATION | -8.86 |
| SEA FARES | -9.11 |
| INTERNET DVDS | -9.42 |
| CARTON/BOX OF CHOCS 150-400GM | -9.91 |
| INTERNET BLU-RAY DISC | -10.09 |
| PRIVATE HEALTH CARE 1 | -11.23 |
| PRIVATE HEALTH CARE 3 | -11.23 |
| MUSIC DOWNLOADS | -14.42 |
| ACTION CAMERA | -16.59 |
| SMART SPEAKER | -21.39 |
In both these tables we look at how much the item price-index for this month has increased since the previous month, expressed as a percentage. These calculations were made by my PhD student at Cardiff University, Yang Li.
Looking Ahead
We can look ahead over the next 12 months to see how inflation might evolve as the recent inflation “drops out” as we move forward month by month. Each month, the new inflation enters into the annual figure and the old inflation from the same month in the previous year “drops out”.[1]
We do this under four scenarios.
- The “medium” scenario assumes that the new inflation each month is equivalent to what would give us 2% per annum – 0.17% pcm -(which is both the Bank of England’s target and the long-run average for the last 25 years)
- The “high” scenario assumes that the new inflation each month is equivalent to 3% per annum (0.25% pcm)
- The “low” scenario equivalent to 1% per annum – (0.08% pcm).
- The “very high” scenario equivalent to 5% per annum – (0.4% pcm). This reflects the inflationary experience of the UK in 1988-1992 (when mean inflation was 0.45%) or recent US experience. It also reflects the continuation of the current UK average in recent months UK. This level of mom inflation would indicate a significant break from the historic behaviour of inflation from 1993-2020.
We have added the “Very High” scenario to reflect the view that is becoming more widespread that inflation may be taking off from recent historic norms.
In addition, we also have additional “drop ins” resulting from government policy:
The reversal of the July 2020 reduction of VAT to only 5% for hospitality, hotel and holiday accommodation and admission to certain attractions. The first increase in VAT from this source was 7.5% at the end of September 2021, which appears in this month’s figures. The next increase of 7.5% is scheduled for the end of March 2022 which will show up in the April 2022 inflation headline. Using the relevant CPI weights, if all the increase were to be passed on, the impact on headline inflation could be over 0.5%. However in September the impact appears to have been extremely modest resulting in a contribution of only 0.1%. The retailers absorbed most of the increase. However, there is a risk that the increase will feed through with a lag, for example, when price lists are changed. In our forecast, we assume that the impact will be higher in April 2022 at 0.3%.
OFGEM. The increase in the energy price-cap from the end of September showed up in this month’s inflation figures. There will be another increase to the price-cap in April 2022. Whilst OFGEM will announce the exact figure for this nearer the time, given the behaviour of energy prices in recent months the increase is likely to be of a similar size to the most recent one. Hence, we have added in an additional “drop in” inflation of 0.4% for April 2022.
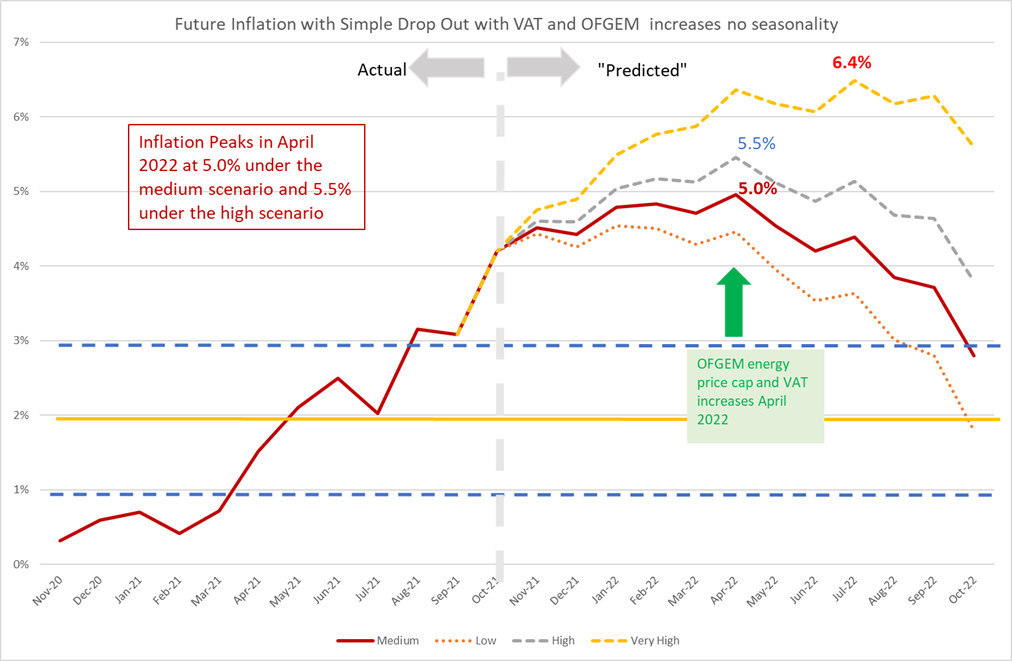
The patterns of the medium and high projections are similar, with a peak in April 2022 of 5% in the medium scenario and 5.5% in the high. After the April peak, inflation heads down and drops to 2.8% in the medium scenario by October 2022. This means that the inflation will remain well above the Bank of England’s target of 2% for some time to come (18-24 months) even if the underlying inflation remains at its historic average as in the medium scenario. In other words, Inflation will remain above 3% for at least 12 months. However, currently monthly inflation is running hotter than the historic average, and if this continues it will delay the reversion to the historic mean.
In the very high inflation scenario, inflation heads up to over 6% by April 2022 and remains there until October 2022. If the supply chain and energy issues persist or get worse, this is the sort of inflationary trajectory we might see. If this trajectory materialised, it would imply a complete failure of the Bank of England’s inflation targeting policy and inflationary expectations would almost certainly move away from their historic 2% anchor. However, even under the medium and high scenarios, the behaviour of inflation will pose a challenge for the Bank’s credibility.
Figure 2: Looking forward to October 2022.

How Long will Inflation remain high?
The future of inflation remains uncertain. However, a simple rule applies. Each month’s “new inflation” stays in the headline figure for 12 months and then drops out. We therefore already know the inflation that will drop out in the next 12 months. We also know that there will be policy effects of VAT and OFGEM increases that will raise inflation in April 2022. What we do not know is the new inflation that will drop in going forward. However, we can say that if the new monthly inflation remains elevated until a certain time and then gets back to “normal” (equivalent to an annual 2%), the headline will take another year until the high inflation has dropped out. Let us suppose that monthly inflation returns to the medium scenario from this November: inflation will remain above 3% until October 2022 and will not return to 2% until April 2023. If monthly inflation remains at the high level (equivalent to 3% annual inflation) then Inflation will remain above 3% until April 2023.
We illustrate this by using our simple drop-in drop-out model and extending it for our four scenarios. Beyond the 12 month horizon, we know neither drop ins or drop outs, so must assume that they are equal. We can see the flat lines after October 2022. Inflation settles down to the mean of each scenario only after both the VAT/OFGEM hikes have dropped out, which happens a year later: the October 2021 hike drops out in October 2022 and the April 2022 hike drops out in April 2023.
Figure 3: Longer term behaviour of inflation.

Whilst the drop-in drop-out model is informative for the next 12 months or so, for longer terms a proper forecasting model is needed to reflectthe underlying pressures on inflation. The NIESR Autumn forecast predicts inflation not getting back to 2% until 2024 and remaining above 3% until late in 2023. This forecast, however, is made under the assumption that private sector long-run inflation expectations remain anchored at 2%. However, there is some evidence that expectations are becoming unanchored, and this will cause great problems for the Bank of England’s Monetary Policy: expectations generate their own inflation and can be difficult to force back down again.
For further analysis of current and future prospects for inflation in the UK see:
- NIESR CPI Tracker
- Will Inflation take off in the UK? The Economics Observatory.
- UK Economic Outlook Autumn 2021: Recovery: Stalling not Soaring
[1] This analysis makes the approximation that the annual inflation rate equals the sum of the twelve month-on-month inflation rates. This approximation ignores “compounding” and is only valid when the inflation rates are low. At current levels of inflation, the approximation works well, being accurate to within one decimal place of percentage annual inflation.
Related Blog Posts


Related Projects


Related News


Why it’s not worth worrying that the UK has technically entered a recession
26 Feb 2024
4 min read
Related Publications

Recessionary Pressures Receding in the Rearview Mirror as UK Economy Gains Momentum
12 Apr 2024
GDP Trackers
Related events

Summer 2023 Economic Forum

Spring 2023 Economic Forum

Winter 2023 Economic Forum

Autumn 2022 Economic Forum

Summer 2022 Economic Forum

Spring 2022 Economic Forum

Winter 2022 Economic Forum
