What will your inflation rate be?
Don’t let the headlines fool you: consumer price inflation is on the rise. Data from the ONS released today shows that in the year to October the consumer price index rose by 0.9 per cent. Quoting the ONS, “Although the rate was slightly lower than in September 2016, it remained higher than the rates otherwise seen since late 2014”. It’s also worth remembering that the ONS figure describe the past, not the future. The impact of the gradual appreciation of sterling that took place between 2013 and 2015 as well as the fall in oil prices witnessed in the first half of 2015 had been weighing down on inflation. As these temporary factors drop out of the calculation, inflation should rebound.
Authors
Don’t let the headlines fool you: consumer price inflation is on the rise. Data from the ONS released today shows that in the year to October the consumer price index rose by 0.9 per cent. Quoting the ONS, “Although the rate was slightly lower than in September 2016, it remained higher than the rates otherwise seen since late 2014”. It’s also worth remembering that the ONS figure describe the past, not the future. The impact of the gradual appreciation of sterling that took place between 2013 and 2015 as well as the fall in oil prices witnessed in the first half of 2015 had been weighing down on inflation. As these temporary factors drop out of the calculation, inflation should rebound.
Looking ahead, consumer prices are expected to increase substantially over the course of next year fuelled by the recent sharp fall of sterling. The recent Tesco and Unilever dispute over a range of products, including Marmite, provides an example where prices could have been going up because of the fall in sterling. Inflation is expected to rise to 2.7 per cent according to the November Inflation Report release by the Bank of England. According to our own forecast published in November, consumer prices are expected to grow at a rate close to 4 per cent by the end of next year.
Economy-wide aggregates mask a great deal of difference in the way each family, with its own unique consumption basket, will experience inflation. Not everyone will be hit in the same way. So who will be likely to suffer the most?
To answer that question we need a detailed picture of the spending patterns of households that sit at different points within the income distribution. The horizontal axis in figure 1 splits the income distribution in income deciles. Number 1 denotes the bottom income decile while number 10 denotes the top. In the vertical axis we decompose total spending into its different categories. The height of each bar denotes the share of total expenditure that households devote to each category. Some examples will clarify the type of items that belong to each category: housing rent belongs to the housing, fuel and power category; buying a car to the health, transport and communication category; a smartphone belongs to the recreation and culture category and mortgage payments fall into the ‘other’ expenditure category.
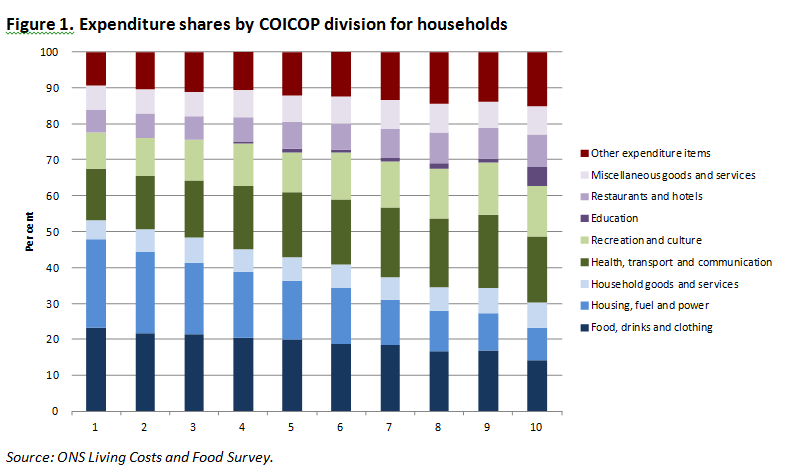
Several patterns soon begin to emerge. Low income households appear to devote a larger share of their total expenditure to necessity items such as food, drinks and clothing (dark blue bar) and paying for their housing rent (light blue bar) than high income households. Instead, high income households devote a larger share of their expenditure to pay for their mortgage (top red bar), health, transport, communication and recreation and culture items (dark and light green bars).
The fall in sterling will make imports more expensive which will result in higher consumer prices. Thus, we need to know which expenditure categories make most intensive use of imports of goods and services to gain a sense of which categories will be most exposed to the rise in import prices. This information is provided in table 2 where we show the import penetration rate of each expenditure category. The import penetration rate is defined as the percentage of expenditure that is directly due to imports.
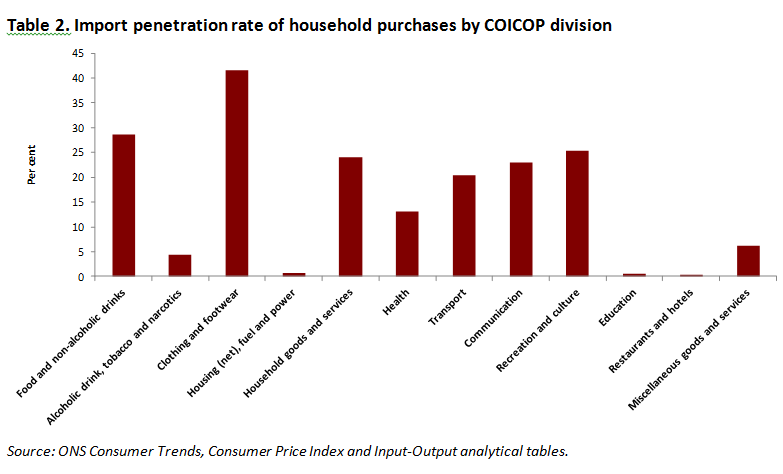
It turns out that those categories that comprise necessity items, such as food and clothing, are the ones that make most intensive use of imports. As a result, we may expect these categories to be the ones that experience the largest increases in prices following the depreciation of sterling.
What about items such as mortgage payments or housing rents? Our view is that mortgage holders will benefit from a sustained period of low Bank Rate which we assume will be passed through to mortgage rates. In our latest forecast published in November, we assume Bank Rate will remain at its current historical low level until mid-2019. Instead, we expect housing rents to keep growing given the strength in demand for housing.
Low income households are likely to experience higher rates of inflation than high income households over the next few years. Households at the bottom of the income distribution devote a larger share of their expenditure to pay for necessity items and those are the ones that will be most affected by the rise in import prices. In addition, while high income households will benefit from a sustained period of low mortgage rates, low income households will still experience increases in their housing rents.
However high inflation will rise for the country as a whole, it will not feel the same to everyone.
Related Blog Posts


Related Projects


Related News

Call for Papers: Lessons From Quantitative Easing & Quantitative Tightening
09 Feb 2024
1 min read


Related Publications

Inflation Differentials Among European Monetary Union Countries: An Empirical Evaluation With Structural Breaks
20 Nov 2023
National Institute Economic Review

The Macroeconomic Effects of Re-applying the EU Fiscal Rules
20 Nov 2023
National Institute Economic Review

Another Look at a Sensible Fiscal Policy for the Sharp Rise in Government Debt
20 Nov 2023
National Institute Economic Review

Monetary Policy: Prices versus Quantities
20 Nov 2023
National Institute Economic Review
Related events

Assessing Cycles and Structural Changes in Markets

Business Conditions Forum