What’s the Future for UK Inflation?
A modest increase in headline inflation masks a high level of new inflation from November to December, with more increases to come leading to a peak in inflation in April of 6.5% or more.
Authors

Headline CPI inflation rose from 5.1% to 5.4%. This may appear at first sight a modest increase. However, the increase of 0.26% from November-December 2020 dropped out and we would have expected a fall in inflation if the new inflation in November-December 2021 was at its long-run level (0.17%, equivalent to 2% annual inflation). Instead, we saw the new inflation for Nov-Dec dropping in at over 0.5% (equivalent to 6.2% annual inflation). This is consistent with the last 10 months: since March 2021, month on month inflation has averaged 0.54%, which is equivalent to annual inflation of over 6.6%.
The increase in inflation was primarily driven by four sectors: Food and Non-Alcoholic Beverages 0.18%, Clothing and Footwear, Restaurants and Hotels, Furniture and Household Equipment each in the range of 0.05-0.07%. However, if we focus on the new month-on month inflation this was largest for three sectors: Food and Non-Alcoholic Beverages, Furniture etc., and Transport.
There are also future price increases built in, most significantly in domestic energy as the OFGEM price cap will be increased in April 2022. The exact figure has not been announced yet. But, given the recent behaviour of energy prices this will be a much larger increase than in April or September 2021. I have increased the impact of inflation from the April 2022 rise from 0.35% to 0.7%, and it could be larger (the actual figure should be announced by OFGEM in February). Rail prices will also rise by 3.8% in March, and the increase in the minimum wage in April may also increase prices in many service sector items. In addition, there is the second increase in VAT on hospitality scheduled for April. However, the impact of this on inflation depends crucially on how much is passed on by hospitality providers.
Overall, the figures out today have raised the future path of inflation over the next 12 months by 0.3 percentage points relative to our previous expectation. And, when combined with the larger OFGEM increase, they now suggest a peak of over 6.5%, and possibly over 7%, if the new month on month inflation remains at the level it has been over the last 9 months.
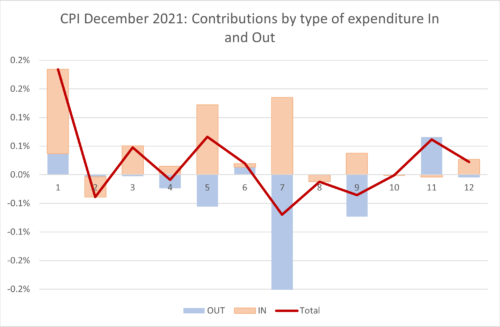
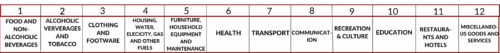
In Figure 1 we see for all twelve COICOP expenditure categories used in CPI the dropping in shaded light brown and the dropping out shaded light blue with the total given by the burgundy Line. In the case of Food and Non-Alcoholic Beverages the dropping in and out reinforced each other. In Clothing & Footwear and Transport, the new and the old inflation worked in opposite directions, leading to an overall increase and decrease respectively.
The overall experience of inflation across sectors remains mixed: in 5 sectors there were (modest) decreases and in 6 sectors increases, with one sector showing no inflation.
Commentary.
The prospects for inflation are now worse than they seemed 9 months ago or even 3 months ago. Of course, even back in April or July, the prospects were very uncertain. This was because of uncertainty about how the imbalance between the supply side and demand side effects of the pandemic and post-pandemic recovery would play out. Very broadly, the government seems to have dealt with the demand side well, and it is the supply side that has come to dominate in the later months of 2021. However, a number of factors have meant that the increase in inflation in the closing months of 2021 has been bigger than expected and the period of elevated inflation will last for longer than we anticipated.
- During the pandemic, there was a shift in expenditure from services to goods. This was in part forced upon consumers during the pandemic and lockdowns, but even as social distancing rules are being relaxed there appears to have been a longer-run shift in expenditure preferences. This has put great pressures on the more industrialised countries to meet this higher demand and within countries their manufacturing sectors. It remains to be seen how persistent this shift in preferences is and whether expenditure patterns will eventually revert to their pre-pandemic pattern or more likely move to some degree of permanent shift to a new post pandemic normal.
- Supply chain shortages have lasted longer than previously thought. Rather than a temporary re-adjustment as the pandemic ended, they have if anything continued to intensify and show little sign of abating in the near future. From seagoing container shipping to lorries, the transportation issues have become worse over time and resulted in delays and increased costs in moving goods around the world and within the UK. Of course, everything in the national and global economy is linked by the web of the Leontief inverse and shortages in one sector or service can affect lots of other sectors either directly or indirectly. How and when these supply chain issues will eventually start to ease is still a matter of considerable uncertainty and things are currently still getting worse rather than better.
- The labour market has been slow to adjust to the rapid changes. Labour shortages have appeared across the globe and are very acute in the UK. Again, this is in part a change in preferences. Workers may have decided to adjust their work-life balance, be more reluctant to commute, be unwilling to change job or decide they want a new start. There is also the shift in employment demand resulting from the shift in expenditure patterns. In normal times there are usually lags and “adjustment costs” that go along with this sort of change in the labour market. Post pandemic, these standard processes of adjustment have become larger and faster, with the labour market and firms having difficulty to cope with these big adjustments. In the UK, the furlough scheme kept people out of the labour market and whilst it may have protected jobs, it has also slowed up labour market adjustment in its later phase. Overall, the big changes in both the demand and supply side of the labour market have persisted for longer than anticipated.
- Wages and salaries. These have proven hard to track during the pandemic due to composition effects (the average rose because lower paid jobs were most affected during the pandemic). The existence of labour shortages persisting may well reflect a mis-match between skills needed and current skills and worker preferences, which may lead to a general increase in wages reinforced by the rising inflation. If this happens, then we will have the positive feedback between wage and price inflation that could lead to an increase in the underlying or “trend” inflation from its historic anchor of 2%.
- The rapid increase in energy prices which are now in the headlines. There is a world imbalance and general excess demand for energy. There are various reasons for this, from the bad winter last year to the lack of wind in Europe and geopolitics. The Ofgem price cap is changed every six months, at the end of September and March, entering the ONS inflation figures for the following months. The big increases in 2021 at these dates seem likely to be repeated at least for April 1st The energy crisis seems to show little chance of ending soon and may get worse if the standoff between NATO and Russia leads to sanctions and restrictions on the gas supply to Europe. There is also little prospect of US sanctions on the big oil producers Iran and Venezuela ending any time soon.
The fact that inflation will remain well above the Bank of England’s target for the next 18-24 months might raise serious questions about continuing the Bank’s policy since 2009 of leaving interest rates fixed at near zero levels. Expectations of underlying inflation are already starting to rise, which will provide serious challenges for monetary policy going forward to bring them back down again.
Extreme Items.
Out of over 700 types of goods and services sampled by the ONS, there is a great diversity in how their prices behave. Each month some go up, and some go down. Looking at the extremes, for this month, the ten items with the highest monthly inflation are:
| Table 1:Top ten items for month-on-month inflation (%), December 2021 | |
| AIR FARES | 38.89 |
| COMPUTER GAME 2 | 24.10 |
| CD ALBUM (TOP 40) | 23.80 |
| COACH FARES | 23.49 |
| HOUSE CONTENTS INSURANCE | 21.36 |
| DWELLING INSURANCE | 16.68 |
| TOMATO KETCHUP BOTTLE 340-570G | 16.01 |
| CD ALBUM (NOT CHART) | 15.81 |
| INTERNET COMPUTER GAMES | 15.12 |
| BAKED BEANS, 400-425G TIN | 9.47 |
The ten items with the highest negative inflation this month are shown in Table 2.
| Table 2: Bottom ten items for mom inflation (%), December 2021 | |
| MIXER DRINK BOTTLE 1L EG TONIC | -7.57 |
| MUSIC DOWNLOADS | -8.62 |
| PLAIN GLASS TUMBLER | -8.90 |
| TOOTHBRUSH | -8.95 |
| CREAM LIQUER 70CL-1LT 14-20% | -9.37 |
| CARTON/BOX OF CHOCS 150-400GM | -9.56 |
| HOTEL 1 NIGHT PRICE | -10.01 |
| COMPUTER GAME DOWNLOADS | -15.31 |
| SMART SPEAKER | -16.55 |
| MOBILE PHONE APPLICATIONS | -17.88 |
In both these tables we look at how much the item price-index for this month has increased since the previous month, expressed as a percentage. These calculations were made by my PhD student at Cardiff University, Yang Li.
Looking Ahead.
We can look ahead over the next 12 months to see how inflation might evolve as the recent inflation “drops out” as we move forward month by month. Each month, the new inflation enters into the annual figure and the old inflation from the same month in the previous year “drops out”.[1]
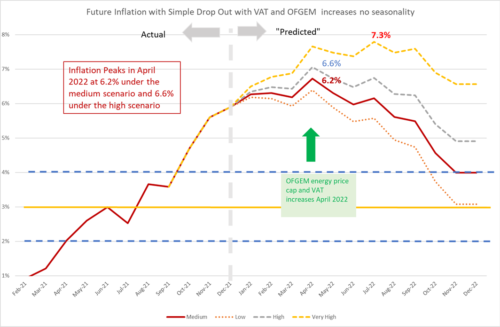
We do this under four scenarios.
- The “medium” scenario assumes that the new inflation each month is equivalent to what would give us 2% per annum – 0.17% pcm – (which is both the Bank of England’s target and the long-run average for the last 25 years)
- The “high” scenario assumes that the new inflation each month is equivalent to 3% per annum (0.25% pcm)
- The “low” scenario equivalent to 1% per annum – (0.08% pcm).
- The “very high” scenario equivalent to 5% per annum – (0.4% pcm). This reflects the inflationary experience of the UK in 1988-1992 (when mean inflation was 0.45%) or recent US experience. It also reflects the continuation of the current UK average in recent months UK. This level of mom inflation would indicate a significant break from the historic behaviour of inflation from 1993-2020.
We added the “Very High” scenario a few months ago to reflect the view that is becoming more widespread that inflation may be taking off from recent historic norms. However, if the future behaviour of inflation is the same as the last 9 months, even the “very high” scenario will seem a conservative underestimate.
In addition, we also have additional “drop ins” resulting from government policy:
[a] The reversal of the July 2020 reduction of VAT to only 5% for hospitality, hotel and holiday accommodation and admission to certain attractions. The first increase in VAT from this source was 7.5% at the end of September 2021, which appeared in the October 2021 inflation figures. The next increase of 7.5% is scheduled for the end of
[1] This analysis makes the approximation that the annual inflation rate equals the sum of the twelve month-on-month inflation rates. This approximation ignores “compounding” and is only valid when the inflation rates are low. At current levels of inflation, the approximation works well, being accurate to within one decimal place of percentage annual inflation.
March 2022 which will show up in the April 2022 inflation headline. Using the relevant CPI weights, if all the increase were to be passed on, the impact on headline inflation could be over 0.5%. However in September the impact appears to have been extremely modest resulting in a contribution of only 0.1%. The retailers absorbed most of the increase. However, there is a risk that the increase will feed through with a lag, for example, when price lists are changed. In our forecast, we assume that the impact will be higher in April 2022 at 0.3%.
The increase in the energy price-cap from the end of September showed up in the October inflation figures. There will be another increase to the price-cap in April 2022. Whilst OFGEM will announce the exact figure for this nearer the time, given the behaviour of energy prices in recent months the increase is likely to be of a similar size to the most recent one. Hence, we have added in an additional “drop in” inflation of 0.7% for April 2022.
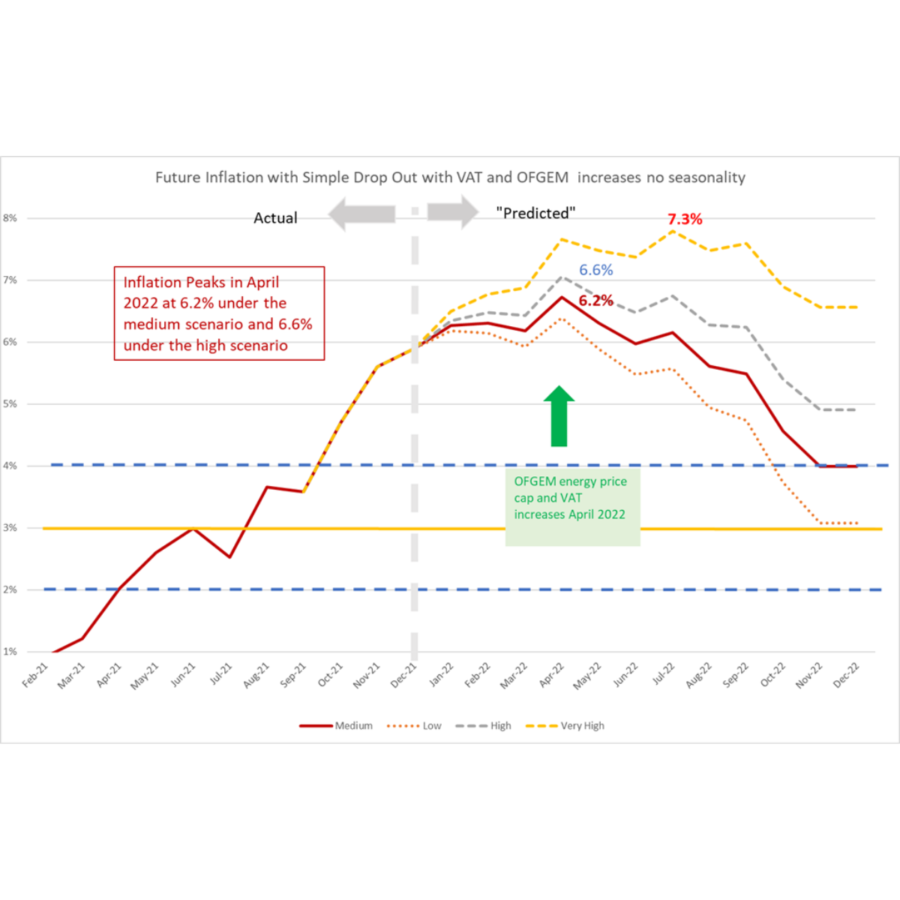
The patterns of the medium and high projections are similar, with a peak in April 2022 of 6.2% in the medium scenario and 6.5% in the high. After the April peak, inflation heads down and by November 2022 drops to 3.5% in the medium scenario and 4.4% in the high scenario. This means that the inflation will remain well above the Bank of England’s target of 2% for some time to come (18-24 months) even if the underlying inflation remains at its historic average as in the medium scenario. In other words, Inflation will remain above 3% for at least 12 months. However, currently monthly inflation is running hotter than the historic average, and if this continues it will delay the reversion to the historic mean well into 2023.
In the very high inflation scenario, inflation heads up to over 7% by April 2022 and remains there until October 2022. If the supply chain and energy issues persist or get worse, this is the sort of inflationary trajectory we might see. If this trajectory materialised, it would imply a complete failure of the Bank of England’s inflation targeting policy and inflationary expectations would almost certainly move away from their historic 2% anchor. However, even under the medium and high scenarios, the behaviour of inflation will pose a challenge for the Bank’s credibility.
Figure 2: Looking forward to December 2022.
For further analysis of current and future prospects for inflation in the UK see:
Will Inflation take off in the UK? The Economics Observatory.
UK Economic Outlook Autumn 2021: Recovery: Stalling Not Soaring.
Related Blog Posts


Related Projects


Related News
Call for Papers: Lessons From Quantitative Easing & Quantitative Tightening
09 Feb 2024
1 min read
Related Publications
Inflation Differentials Among European Monetary Union Countries: An Empirical Evaluation With Structural Breaks
20 Nov 2023
National Institute Economic Review
The Macroeconomic Effects of Re-applying the EU Fiscal Rules
20 Nov 2023
National Institute Economic Review
Another Look at a Sensible Fiscal Policy for the Sharp Rise in Government Debt
20 Nov 2023
National Institute Economic Review
Monetary Policy: Prices versus Quantities
20 Nov 2023
National Institute Economic Review
Related events
Assessing Cycles and Structural Changes in Markets
Business Conditions Forum