Press Release: NIESR Weekly Covid-19 Tracker – Continued local surges and flare ups
Main points
- We report estimates of the R number and forecasts for new cases of Covid-19, hospital admissions, and deaths due to Covid-19 using data that was publicly available as of 25th May 2021. In light of the low case rates (see below) this tracker will now be produced at fortnightly frequency from next week. Deaths are currently very low, so forecasts of it have been dropped.
- Figure 1 shows that the Reproduction number, R, for England. R is the average number of secondary infections currently generated by an infected individual, and is estimated to be in the range of 1.00 – 1.15 based on specimen date data until 21st May.
- This is to be seen in the context of 7-day case rates (calculated as the count of cases per 100,000 people over the last 7 days) in all nations and regions being less than 50 per 100,000 people. From this low base small changes in case numbers can have large effects on growth rates of new cases. As R is calculated directly as a function of growth rates of new cases (see Harvey and Kattuman, 2020b) the Reproduction number, R, if considered in isolation, can give a misleading picture. In particular, an increase in cases within a local area can affect a wider region’s reported R and not the underlying transmission within the region.
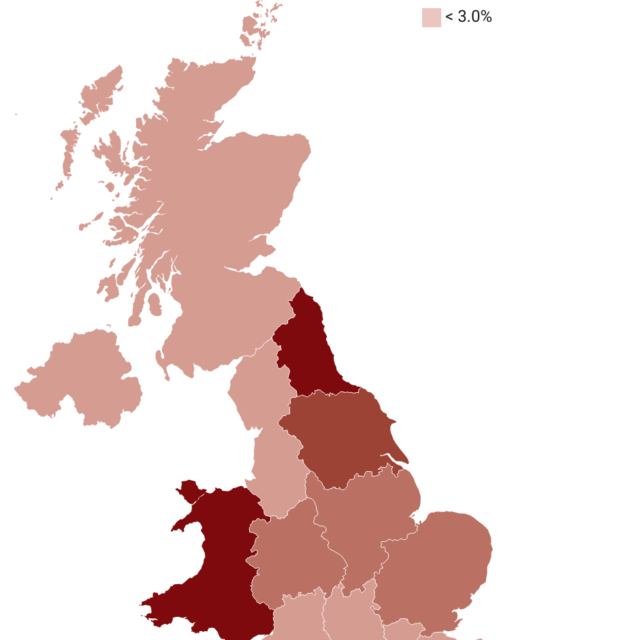
- For Northern Ireland the R number is in the range 0.90 – 1.10 (7-day case rate per 100, 000 of 33); for Wales, 0.95 – 1.10 (case rate of 9) and for Scotland, 1.10 – 1.25 (case rate of 44). The regional R number estimates and case rates given in Figure 5 show that, currently, the East Midlands (case rate of 21) has the lowest R number while the North West (case rate of 50) has the highest value across England’s regions.
- Based on our model, by 21st June when step 4 re-opening is due, we expect the trend value of daily cases in the UK to be around 3,100 and admissions to be below 100 (Figures 3-4).
- We also monitor local authorities with relatively high case rates. Figure 5 shows that the R number is in the range 1.05 – 1.35 for Bolton (case rate 451), 1.35 – 1.85 for Blackburn and Darwen (case rate 281) and 1.15 – 1.70 for Bedford (case rate 128). These numbers are to be seen in the context of the policy of increased testing in local authorities with relatively high case rates.
Dr Craig Thamotheram, Senior Economist – Macroeconomic Modelling and Forecasting, said:
“It is reassuring that the weekly case rate per 100,000 is smaller than 50 in all regions and nations. However, evident localised outbreaks have the potential to seed a new wave. The extent to which flare ups are contained will be key in the weeks ahead. Based on the latest data on new cases, our estimate of the R number for England lies in the range 1.00 – 1.15, increasing from last week. This estimate is based on data up to 25th May 2021.”
Please find the full analysis in the document attached
———————————————————————
Notes for editors:
For further information please contact the NIESR Press Office: press [at] niesr.ac.uk or
Luca Pieri on l.pieri [at] niesr.ac.uk / 07930 544 631
National Institute of Economic and Social Research
2 Dean Trench Street
Smith Square
London, SW1P 3HE
United Kingdom
Switchboard Telephone Number: 020 7222 7665
Website: http://www.niesr.ac.uk

