Press Release: NIESR Weekly Covid-19 Tracker – Reproduction Number (R) and Forecasts of New Cases: R drops before Easter
Main points
- We report estimates of the R number and forecasts for new cases of Covid-19, hospital admissions, and deaths due to Covid-19 using data that was publicly available as on 6th April 2021.
- Data on Covid-19 cases are reported by the government by ‘specimen date’ and by ‘published date’. Specimen cases relate to the date when the sample was taken from the person being tested, while published cases relate to the first date when they are included in the published numbers. At the present time we regard the specimen date data as a more reliable indicator of the trend in new cases. The model based on specimen dated observations has better captured the effect of the sharp increase in testing on the day that schools reopened.
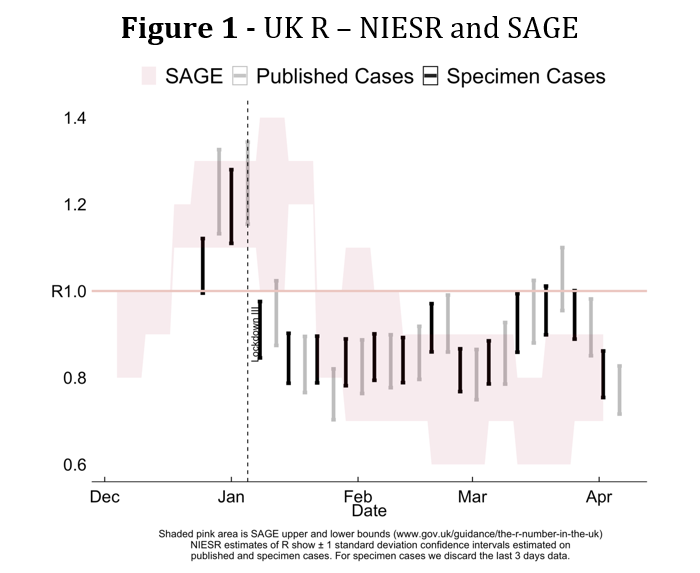
- Figure 1 shows that the Reproduction number, R, which is the average number of secondary infections currently generated by an infected individual, estimated using the specimen date data until 2nd April, decreased to 0.75 – 0.85. For specimen cases, we choose to set the Easter bank holidays to missing values to downplay the under reporting on bank holidays that was observed on previous bank holidays. We leave published cases unchanged.
- Further evidence from Imperial’s REal-time Assessment of Community Transmission-1 (REACT-1) confirms the levelling off in cases we reported in mid to late March. Their study based on home swab tests conducted between 11th to 30th March and released on 8th April estimated the R number at 1.0 during this period. This again highlights the timeliness of our method for estimating the R number – our estimates were in that range some 2 to 3 weeks before the REACT-1 estimates were published.
- Based on our model, by 12th April when non-essential retail is scheduled to reopen, we expect the trend value of daily cases to be around 1,900; admissions to be around 100, and deaths to stay well below 50 (Figures 3-5). Our forecasts for deaths are unchanged relative to last week, but our forecast for admissions is lower by 100 and cases by 1,900.
- To the extent that each stage of re-opening increases transmission these numbers may increase. At the same time, expansion of the vaccination programme can be expected to reduce transmission. The trajectory that nets out these opposing trends will become evident in the weeks to come.
- Figure 6 shows the regional R number estimates. Currently, the South West has the lowest R number while the North East has the highest.
Dr Craig Thamotheram, Senior Economist – Macroeconomic Modelling and Forecasting, said: “Based on the latest data on new cases, our estimate of the R number for the UK lies in the range 0.75 – 0.85, down from just below 1 last week. This estimate is based on data up to 6th April 2021. Our R number estimate sat just below 1 from mid to late March. This is above those of SAGE but now supported by the survey estimates from the REACT-1 study of Imperial College published on 8th April. Reassuringly, data in the week before the Easter break shows a consistent decrease in cases. This has pushed our R estimate down. Hospital admissions and deaths due to Covid-19 continue their steady decline.”
Please find the full analysis in the document attached
———————————————————————
Notes for editors:
For further information please contact the NIESR Press Office: press [at] niesr.ac.uk or
Luca Pieri on l.pieri [at] niesr.ac.uk / 07930 544 631
National Institute of Economic and Social Research
2 Dean Trench Street
Smith Square
London, SW1P 3HE
United Kingdom
Switchboard Telephone Number: 020 7222 7665
Website: http://www.niesr.ac.uk
Related Blog Posts


Related Projects


Related News


Why it’s not worth worrying that the UK has technically entered a recession
26 Feb 2024
4 min read

1.2 million UK Households Insolvent This Year as a Direct Result of Higher Mortgage Repayments
22 Jun 2023
2 min read

The Key Steps to Ensuring Normal Service is Quickly Resumed in the Economy
13 Feb 2023
4 min read
Related Publications

Recessionary Pressures Receding in the Rearview Mirror as UK Economy Gains Momentum
12 Apr 2024
GDP Trackers
Related events

Summer 2023 Economic Forum

Spring 2023 Economic Forum

Winter 2023 Economic Forum

Autumn 2022 Economic Forum

Summer 2022 Economic Forum

Spring 2022 Economic Forum

Winter 2022 Economic Forum
