February 2014 GDP Estimate
 Pub. Date
 Pub. Type
Authors

Our monthly estimates of
Note: NIESR’s latest quarterly forecast (published 7th February 2014) projects
Figure 1. The profile of recession and recovery
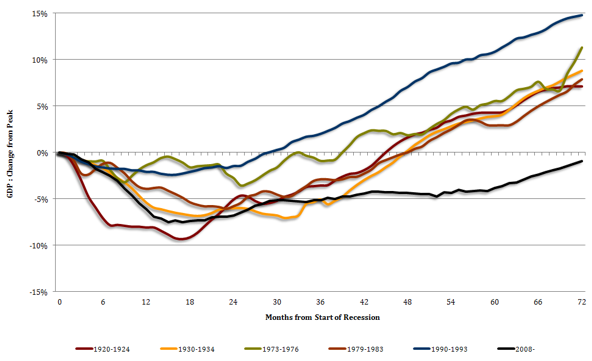
Notes: Calculated from centred three-month moving averages of monthly
The National Institute interprets the term “recession” to mean a period when output is falling or receding, while “depression” is a period when output is depressed below its previous peak. Thus, unless output turns down again, the recession is over, while the period of depression is likely to continue for some time. We do not expect output to pass its peak in early 2008 until 2014.
Our track record in producing early estimates of
A paper describing the methodology used to produce the data was published in the February 2005 volume of the Economic Journal:
Mitchell, J. Smith, R. J., Weale, M. R., Wright, S. and Salazar, E. L. (2005) ‘An Indicator of Monthly
Available from: http://onlinelibrary.wiley.com/journal/10.1111/(ISSN)1468-0297
A paper describing the methodology used to produce the data for the inter-war period was published in the October 2012 volume of Explorations in Economic History:
Mitchell, J., Solomou, S. and Weale, M. (2012) ‘Monthly
Available from: http://www.journals.elsevier.com/explorations-in-economic-history/
From April until October 2006 our estimates were computed using the Index of Services published by ONS. However this monthly series shows considerable volatility which has caused us some problems in estimating
For more information please telephone Simon Kirby (NIESR, Centre For Macroeconomics) on 020 7222 7665.
Related Blog Posts


Related Projects


Related News


Why it’s not worth worrying that the UK has technically entered a recession
26 Feb 2024
4 min read

1.2 million UK Households Insolvent This Year as a Direct Result of Higher Mortgage Repayments
22 Jun 2023
2 min read

The Key Steps to Ensuring Normal Service is Quickly Resumed in the Economy
13 Feb 2023
4 min read
Related Publications
Recessionary Pressures Receding in the Rearview Mirror as UK Economy Gains Momentum
12 Apr 2024
GDP Trackers
UK Economy on the Road to Recovery in 2024 Following the Mild Recession
13 Mar 2024
GDP Trackers
Related events

Summer 2023 Economic Forum

Spring 2023 Economic Forum

Winter 2023 Economic Forum

Autumn 2022 Economic Forum

Summer 2022 Economic Forum

Spring 2022 Economic Forum

Winter 2022 Economic Forum
