NIESR CPI Tracker – April 2020
 Pub. Date
 Pub. Type
CPI Reflects Lower Fuel Prices
The consumer price index inflation rate decreased by 0.2 percentage points to 1.5 per cent in the year to March 2020, as per data released by the ONS. Our new analysis of 120,395 locally collected goods and services indicates that consumers benefitted from lower prices in clothing and footwear and motor fuels, as reflected in the transport category. We expect the transport category will be subject to further price reductions in the coming months, reflecting both the drop in demand for fuels as well as lower fuel prices due to the supply glut in international oil production. Underlying inflation, which excludes the most extreme price changes, decreased in all the UK regions. This widespread moderation led to a reduction in underlying to 0.7 per cent in March, down from 0.9 per cent recorded in February. This is consistent with headline CPI inflation rising to 1.9 per cent in the 12 months to March 2021.
Approximately 45 per cent of the prices recorded in the CPIH (CPI including owner occupiers’ housing costs) is collected manually every month, with the remaining observations gathered from online sources and admin data. The price collection for March 2020 was completed before the commencement of the lockdown and is unaffected by the most recent developments. The ONS have indicated a disruption to the manual price collection process as their staff adhere to social distancing guidelines. Starting from next month, store prices will be checked telephonically or online where possible, with any missing values imputed using processes outlined in the Consumer Prices Indices Technical Manual. Silvana Tenreyro, an external member of the Bank’s MPC, stated that a critical shift in spending patterns during the pandemic will likely change the representative consumption basket. As such, CPI statistics in the near-term may not reflect the spending decisions of households or the true extent of inflation recorded in the economy.
Main points
- Underlying inflation decreased to 0.7 per cent in the year to March 2020, as measured by the trimmed mean, which excludes 5 per cent of the highest and lowest price changes (figure 1).
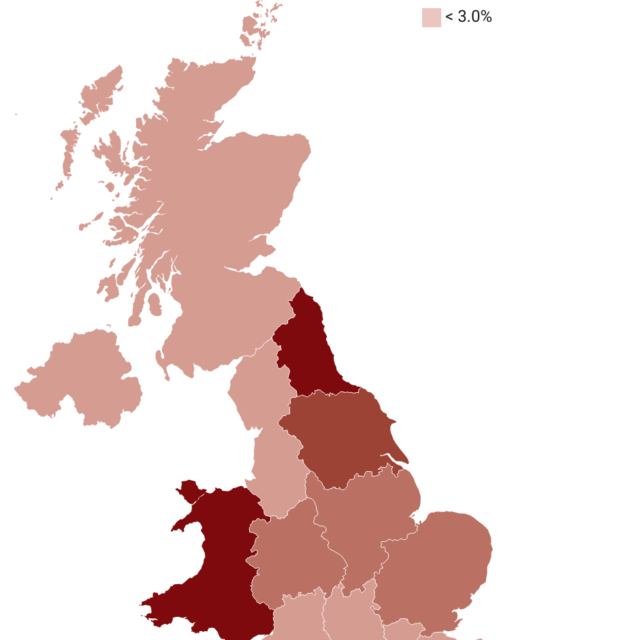
- At the regional level, underlying inflation was highest in Northern Ireland at 1.0 per cent and lowest in South West and East Anglia at 0.4 per cent in the year to March 2020 (table 1).
- 19.7 per cent of goods and services prices changed in March, implying an average duration of prices of 5.1 months. 5.3 per cent of prices were reduced due to sales, 4.6 per cent fell for other reasons and 9.8 per cent were increases (figure 2).
- The historical relationship between current trimmed mean inflation and future CPI inflation implies CPI inflation of 1.9 per cent in the year to March 2021.
“Headline CPI inflation decreased to 1.5 per cent in the year to March 2020, down from 1.7 per cent recorded in February. Our analysis of approximately 120,000 goods and services included in the basket indicates that lower prices in clothing and footwear and the transport categories contributed meaningfully to the moderation in inflation recorded in March. Our measure of underlying inflation, which excludes extreme price movements, decreased to 0.7 per cent in March thanks to a reduction in underlying inflation across all the regions of the UK. On this basis, we expect CPI inflation to settle around the Bank of England’s target of 2 per cent in the coming year.”
Janine Boshoff, Economist, Macroeconomic Modelling and Forecasting

