R Unchanged For Now
 Pub. Date
 Pub. Type
Authors

Main points
- We report estimates of the R number and forecasts for new cases of Covid-19, hospital admissions and deaths due to Covid-19 using publicly available data on 30th March 2021
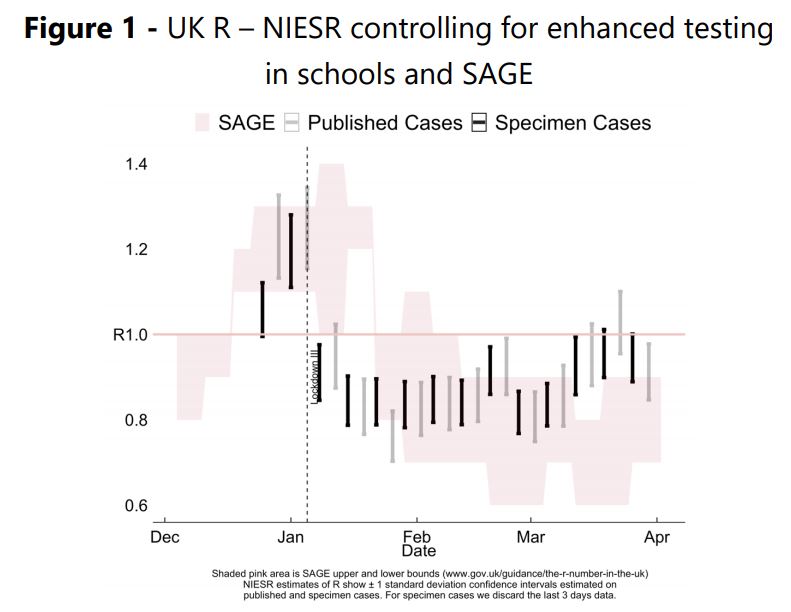
- Data on Covid-19 cases are reported by the government by ‘specimen date’ and by ‘published date’. Specimen cases relate to the date when the sample was taken from the person being tested, while published cases relate to the first date when they are included in the published numbers. At the present time we regard the specimen date data as a more reliable indicator of the trend in new cases. The model based on specimen dated observations has better captured the effect of the sharp increase in testing on the day that schools reopened.
- Figure 1 shows that the Reproduction number, R, which is the average number of secondary infections currently generated by an infected individual, estimated using the specimen date data until 26th March, remained at 0.9 – 1.0. This is again higher than SAGE’s estimates. Our estimate was obtained after controlling for enhanced testing in schools that started when they reopened on the 8th of March. The model without any correction for enhanced testing in schools yields similar estimates as of now, as three weeks on, the effect of the discontinuous change in testing plays less of a role in recovering the underlying trend.
- Based on our model, by 12th April when non-essential retail is scheduled to reopen, we expect the trend value of daily cases to be around 3,800; admissions to be around 200, and deaths to stay below 50 (Figures 3-5). Our forecasts for cases and deaths are unchanged relative to last week, but our forecast for admissions is higher by 100.
- To the extent that each stage of re-opening increases transmission these numbers may increase. At the same time, expansion of the vaccination programme can be expected to reduce transmission. The trajectory that nets out these opposing trends will become evident in the weeks to come.
- Figure 6 shows the regional R number estimates. Currently, the North East has the lowest R number while Yorkshire and the Humber has the highest.
“Based on the latest data on new cases, our estimate of the R number for the UK lies in the range 0.9 – 1.0, unchanged from last week. This estimate is based on data up to 30th March 2021. Our model controls for increased testing in schools from 8th March, and finds that in the three weeks that followed increased transmissions have pushed the estimate of the R number ever closer to 1. That is, cases are still decreasing but at a slower rate than they were when schools reopened. Looking ahead, the key as to whether the R number moves above 1 and cases start to rise will be the trade-off between increases in transmission due to increased social interaction and any effect the continued rollout of the vaccine has on reducing transmissions. Reassuringly, hospital admissions and deaths due to Covid-19 continue their steady decline.”
Related Blog Posts


Related Projects


Related News


Why it’s not worth worrying that the UK has technically entered a recession
26 Feb 2024
4 min read

1.2 million UK Households Insolvent This Year as a Direct Result of Higher Mortgage Repayments
22 Jun 2023
2 min read

The Key Steps to Ensuring Normal Service is Quickly Resumed in the Economy
13 Feb 2023
4 min read
Related Publications
Recessionary Pressures Receding in the Rearview Mirror as UK Economy Gains Momentum
12 Apr 2024
GDP Trackers
UK Economy on the Road to Recovery in 2024 Following the Mild Recession
13 Mar 2024
GDP Trackers
Related events

Summer 2023 Economic Forum

Spring 2023 Economic Forum

Winter 2023 Economic Forum

Autumn 2022 Economic Forum

Summer 2022 Economic Forum

Spring 2022 Economic Forum

Winter 2022 Economic Forum
