Summary of NIESR forecasts ahead of key Bank of England report
 Pub. Date
 Pub. Type
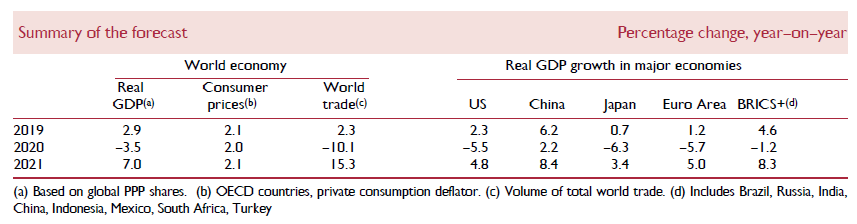
Ahead of the Bank of England’s MPC meeting and quarterly monetary policy report on Thursday, here below a summary of key points outlined in our latest analysis for the UK and global economy, available in full here.
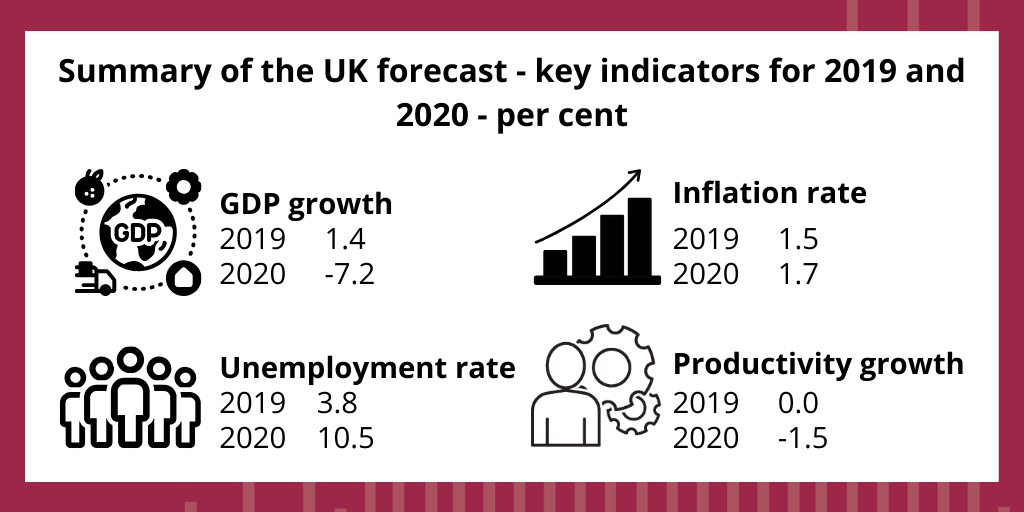
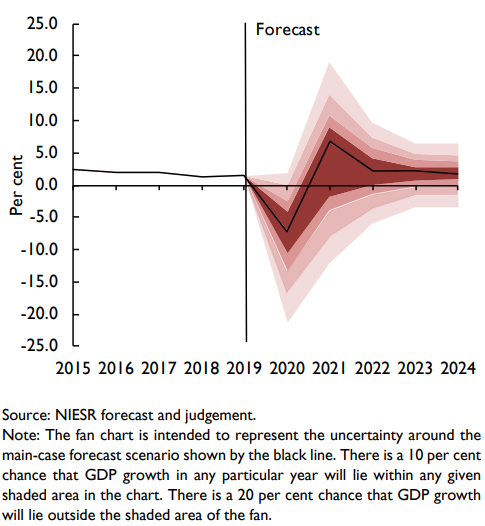
GDP is estimated to be reduced by about 30 per cent when the lockdown is in operation. With the lockdown assumed to be in place from around the middle of March to the middle of May, UK GDP falls by around 5 percent in 2020Q1 and 15 per cent in 2020Q2. In our main-case scenario, we forecast GDP falls by 7 per cent in 2020. On the assumption of a progressive relaxation of stay-at-home measures, GDP then recovers some of the lost ground and almost re-attains its 2019Q4 level by 2021Q4 but there are significant downside risks, alongside uncertainties that cannot be easily resolved.
Chart 1: GDP growth fan chart (per cent per annum)
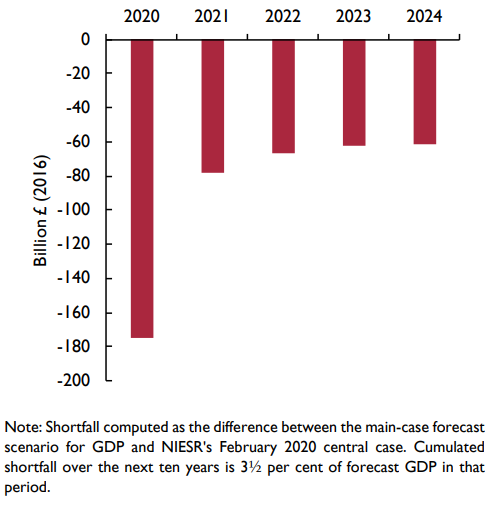
In this main-case scenario, GDP is lower by about £175 billion in 2020 and £75 billion in 2021 than we had expected in January. It is also lower in future years reflecting a very uncertain permanent scarring effect from Covid-19. Over the next ten years this loss of output cumulates to around £800 billion, or £11,000 per head. This is equivalent to a loss of GDP of around 3½ per cent each year over the next ten years, though the economic cost is front-loaded.
Chart 2: The estimated GDP shortfall due to Covid-19
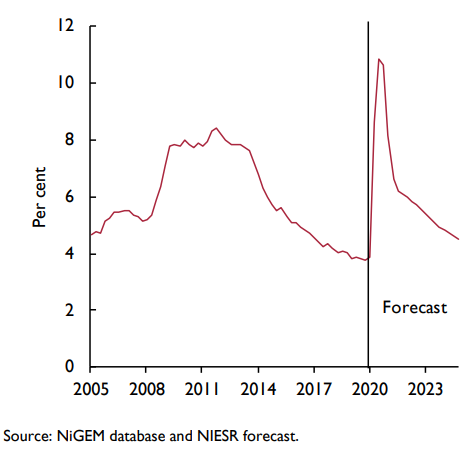
The Coronavirus Job Retention Scheme is assumed to be effective in limiting the fall in employment in 2020 to around 1½ million. Unemployment rises to around 3 million, about 8½ per cent of the labour force, and falls back towards 2 million in 2021.
For further reading on unemployment, please see the article published in our latest Review by Prof. Blanchflower and Prof. Bell, ''US and UK Labour Markets Before and During the Covid-19 Crash''
Chart 3: UK ILO unemployment rate and forecast
The various mitigation measures that have been announced by the UK government are estimated to reduce the adverse impact of Covid-19 on GDP by about 2 per cent at a direct cost to the exchequer of about £75 billion. One of the key mitigating policies has been the introduction of the Coronavirus Job Retention Scheme (CJRS). This is currently planned to run up to the end of June and appears to be providing businesses with a lifeline to survival. But it is very important that it is retained and adapted beyond the full lockdown period.
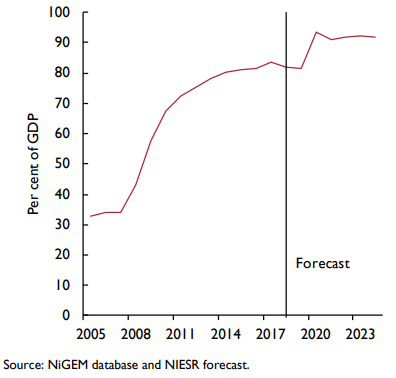
Public sector borrowing rises from 2.6 per cent of GDP in 2019–20 to just over 10 per cent of GDP in 2020–21, above £200 billion, over £150 billion more than in the OBR's forecast at budget time. The counterpart to higher public sector borrowing is higher private sector saving. The deficit on the current account of the balance of payments falls from 3.8 percent of GDP in 2019 to around ½ per cent of GDP in 2020 as imports fall by more than exports.
Chart 4: Public sector net debt
The stay-at-home measures result in output being reduced directly in the sectors where they are applied. There are also knock-on effects as those sectors lay off workers and reduce their demand for inputs from other sectors. The chart below shows the direct quarterly effect of stay-at-home measures applied for 6–7 weeks on sectoral GDP and their estimated overall effect within the same quarter when spillovers onto other sectors are taken into account.
Chart 5: Illustrative effect of stay-at-home measures on sectoral GDP
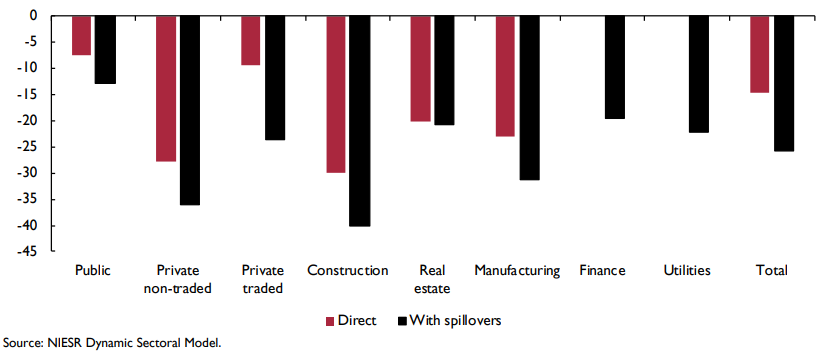
These factors are important in estimating the economic effects of targeted measures to get the economy back to work. They suggest that to get the economy moving again it will be important to allow as many upstream and complementary activities to start as early as possible while maintaining safe social distancing. This would point to opening up construction, manufacturing and private non-traded activities while insisting that other more downstream industries and activities continue to be done from home.
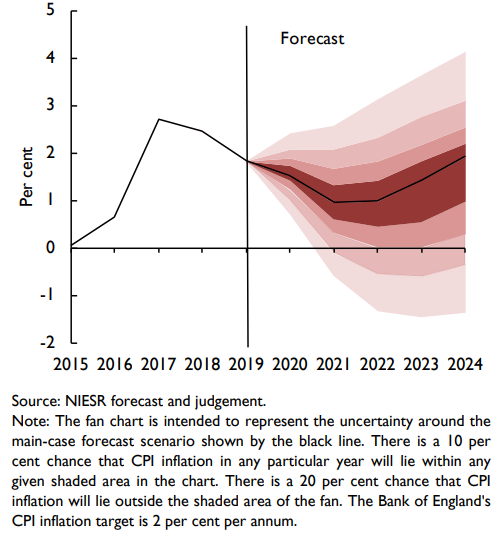
Despite the large rise in unemployment and contraction in output, CPI inflation falls only a little below the 2 per cent inflation target in the main-case forecast scenario.The household saving ratio rises from around 6 per cent in 2019 to 17 per cent in 2020, when spending opportunities are limited, before falling back to 8 per cent in 2021.
Chart 6: Inflation fan chart (per cent per annum)
With regard to the Global Economy, we project that global GDP will fall by 3½ per cent this year, a downward revision of around 6½ percentage points from our view in February. The fall in GDP is substantially larger than during the Financial Crisis (–0.1 per cent). The closest parallel is the Great Depression, when there was multi-year fall in output.
Chart 7: World GDP
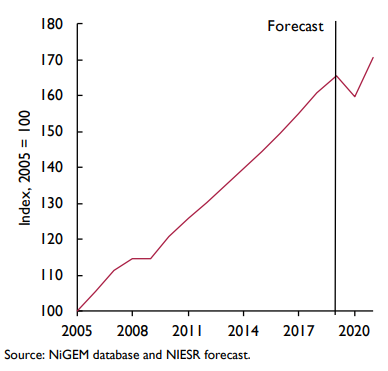
You can read the full analysis on the Global Economy here.
Related Blog Posts


Related Projects


Related News

Call for Papers: Lessons From Quantitative Easing & Quantitative Tightening
09 Feb 2024
1 min read

Related Publications

Low-Key Budget Unlikely to Unlock Productivity Growth: NIESR’s Response to the Spring Budget 2024
06 Mar 2024
Budget/Fiscal Event Comment
Inflation Differentials Among European Monetary Union Countries: An Empirical Evaluation With Structural Breaks
20 Nov 2023
National Institute Economic Review

The Macroeconomic Effects of Re-applying the EU Fiscal Rules
20 Nov 2023
National Institute Economic Review
Related events
Assessing Cycles and Structural Changes in Markets

Business Conditions Forum