Friday Flyer: Income Growth: why no one is happy
This week the Institute published its November Review and much of the focus was rightly on our projections of an increasing divergence in growth between the UK and other advanced economies. But what we also did was to look under the bonnet of these aggregate effects and try to understand what globalisation has meant for the different sectors, regions and households that add up to the averages. In this blog I shall illustrate by examining, the composition of post-tax income growth, why so many sections of the household income distribution are dis-satisfied with economic progress since the financial crisis.
Authors
This week the Institute published its November Review and much of the focus was rightly on our projections of an increasing divergence in growth between the UK and other advanced economies. But what we also did was to look under the bonnet of these aggregate effects and try to understand what globalisation has meant for the different sectors, regions and households that add up to the averages. In this blog I shall illustrate by examining, the composition of post-tax income growth, why so many sections of the household income distribution are dis-satisfied with economic progress since the financial crisis.
Using data from the ONS I examined the post-tax income of taxpayers at each percentile from 1 to 99 from 1999-00 to 2014-15. (Note that data for 2008-9 is not available.) To be clear the numbers tell you where in the overall distribution your income might lie. For example, the median (50th percentile) taxpayer had an income of £12,500 after tax in 1999-2000 and £20,000 in 2014-15. This number is a little misleading for two reasons. One it is in nominal terms and so to understand purchasing power we need to deflate by change in the price level over the two reference points years. But perhaps even more importantly, it does not track the median taxpayer in 1999-2000 and ask what happened to her. The median taxpayer in 1990-2000, if she stayed in work, may have become a taxpayer in the upper percentiles by 2014-5 or if bad states of nature had come along may have fallen down the income spectrum. Much of modern econometric analysis tries to condition on exactly these kinds of effects. I do not do that here.
What I do is to plot the income of the 20th percentile, the median and the 80th percentile over this period, having controlled for changes in the overall price level measured by CPI. So the lines represent income in terms of prices in 1999-2000. And we can begin to understand why there is so much dissatisfaction. To help for each part of the income segment I have drawn a trendline. This trendline serves two purposes. It tells us first that there has been more real income growth at the 80th percentile than the 50th percentile and more at the 50th percentile than the 20th percentile because the lines are progressively steeper as we move up the income distribution. But note that I have not conducted formal statistical tests of the difference in slopes (yet).
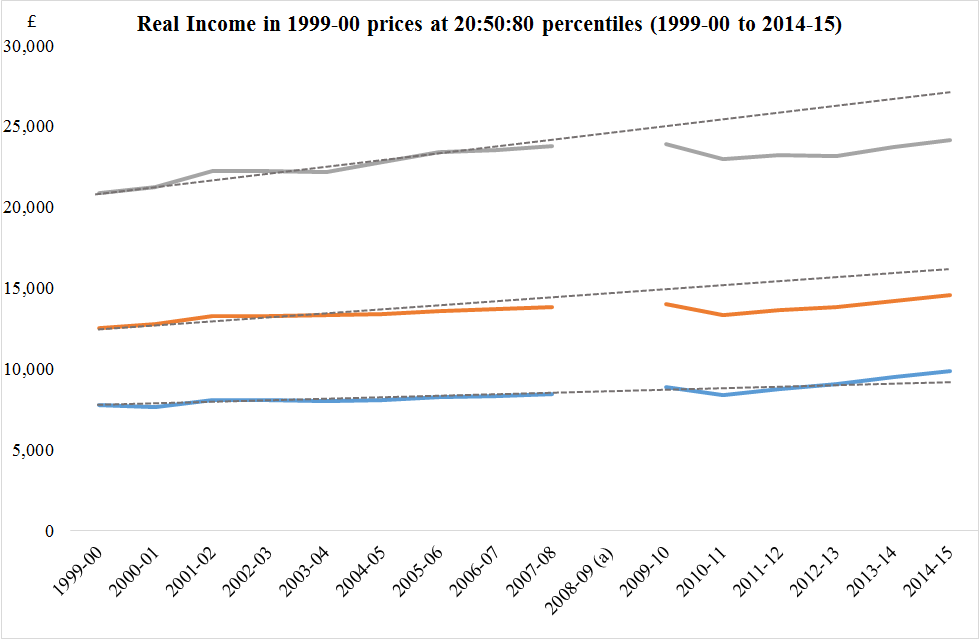
But there is another use of the trendlines. They might tell us how expectations have been frustrated. For both the 50th and 80th percentile, the actual change income since 2009-10 has been below the previous trend, or possibly “expectation”. Again, I have not tested to see if the outcomes are significantly different to the trends but the perception of strong divergence in outcomes is clear.
So we have it. Taxpayers at the lower levels of post-tax income may be frustrated because the previous low rate of income growth has been maintained. And taxpayers at the median and 80th percentile might be frustrated because even though they have experience some income growth is has been what they might have anticipated. Obviously, no-one can outline the counterfactual of how much worse income might have been with stabilising monetary and fiscal policies but people will gauge their well-being with respect to these kinds of outcomes.
The globalisation of production and the sources of consumption is hardly new but its consequences have become the economic leitmotif of our times, as it cuts across so many political questions that regularly dominate the agenda here and overseas. Economists commit the Ricardian vice of promoting the long run gains from trade and sometimes neglect the possibility of short run costs, which may not be easy to observe in aggregate but certainly bear down on at the disaggregated level in sectors, regions and households. As we argued immediately after the referendum, “the intellectual journey taken by policymakers since 2007-8, in that less attention has been placed on the average but more on dealing with the tails of the distribution”. This is because the economy tends to be buffeted as a result of aggregate shocks but their impact is not uniform. Different sections of the population experience the effects of these shocks in often quite different ways as I have illustrated here.
Related Blog Posts


What Are the Implications of the Rising National Minimum Wage and National Living Wage Rates?
19 Mar 2024
5 min read


Related Projects


Related News


Press Release: Compositional effects push up average weekly earnings at the end of 2020
26 Jan 2021
2 min read
Press Release: 2020 shaping up to be the worst year for total pay growth since 2009
15 Dec 2020
2 min read
Related Publications

Pay-Setting Among Employers in the Agriculture, Cleaning, Hospitality and Retail Sectors
11 Mar 2024
Research Report

Job Boom or Job Bust? The Effect of the Pandemic on Actual and Measured Job and Employment Growth
07 Feb 2024
UK Economic Outlook Box Analysis

Kurzarbeit/Short Time Working: Experiences and Lessons from the Covid-Induced Downturn
20 Nov 2023
National Institute Economic Review

Related events
