How much would a ‘White Paper Brexit’ cost the UK economy?
The UK government published a White Paper on 12th July outlining its preferences for a future relationship with the EU. In this blog we compare the proposals outlined in the White Paper against other EU free trade agreements (FTA) and also estimate the impact on the UK relative to our central forecast, published in August 2018, that assumes a soft Brexit.
Our results suggest that the UK is looking for a trading relationship that is similar in scope to the arrangement between the EU and Switzerland. If that is indeed the case, we believe that the EU will insist that the UK make concessions on the freedom of movement of people and also ask for a budgetary contribution to EU programmes related to the single market.
We estimate that the economy will suffer an annual loss of around £500 per head over time if the White Paper proposals are broadly agreed.
Authors
The UK government published a White Paper on 12th July outlining its preferences for a future relationship with the EU. In this blog we compare the proposals outlined in the White Paper against other EU free trade agreements (FTA) and also estimate the impact on the UK relative to our central forecast, published in August 2018, that assumes a soft Brexit.
Our results suggest that the UK is looking for a trading relationship that is similar in scope to the arrangement between the EU and Switzerland. If that is indeed the case, we believe that the EU will insist that the UK make concessions on the freedom of movement of people and also ask for a budgetary contribution to EU programmes related to the single market.
We estimate that the economy will suffer an annual loss of around £500 per head over time if the White Paper proposals are broadly agreed.
Benchmarking the White Paper proposals
The World Bank database of preferential trade agreements, provides a detailed measure of the depth of all the agreements worldwide that were signed after 1957. We update that database with the White Paper proposals, using a similar methodology that we used in a previous study to evaluate the Canada-EU FTA (CETA).
A typical trading relationship covers a very wide range of issues ranging from the products that are included to rules for public procurement, competition policy, education and training, copyright protection, human rights etc. We have developed a scoring system that attempts to capture the breadth of the coverage as well as the depth. Points are awarded for a mention in law and an additional point is awarded if the agreement also specifies a dispute resolution mechanism.
Our results suggest that the trade intensity of the White Paper proposals is comparable to Switzerland or Canada and is less comprehensive than a Norway-style EEA arrangement. The score essentially reflects a comprehensive FTA for goods and the shortfall is explained by the proposals for services.
Non-EU countries that have secured deep and broad trading arrangements with the EU have had to concede ground on the free movement of labour, the jurisdiction of the CJEU and/or make a budgetary contribution to various programmes run by the EU.
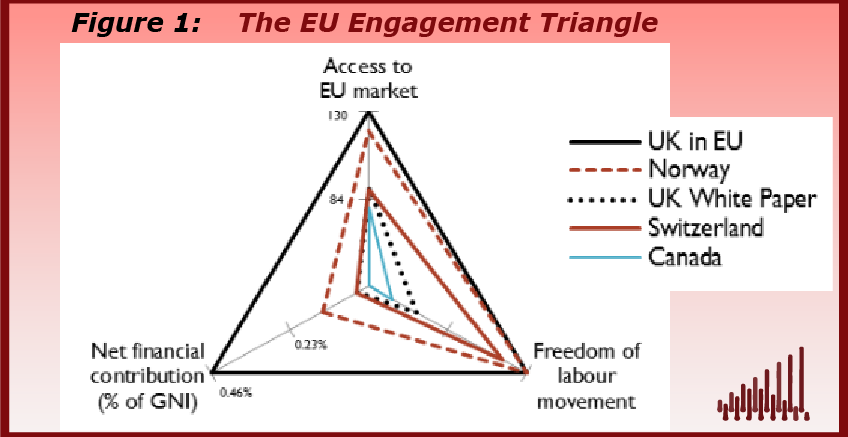
Figure 1 is a visual representation of the extent of the depth and breadth of EU engagement. We have selected three key dimensions to define the relationship between the EU and non-EU countries and the vertices of the triangle correspond to each of these: full market access, complete freedom of movement of people and size of the financial contribution (as a percentage of Gross National Income). One could add other dimensions to the analysis such as the role of the CJEU, security, defence, fiscal harmonisation, but we have, for the sake of simplicity, restricted our analysis to what we believe are the three most important areas of negotiation between the UK and the EU.
Briefly, the largest triangle represents the UK current level of engagement as a member state of the EU: the UK has full access to the EU market in goods and services, allows EU citizens to move freely in and out of the UK, and contributes about 0.5% of GNI to the EU budget, net of what it receives. Norway opted to join the European Economic Area (EEA) to have close to full access to the single market, both in goods and services. The dashed red triangle shows that, to be accepted as a member of the EEA, Norway had to agree to significant financial contributions (“Norway Grants”, amounting to 0.14% of GNI) and freedom of movement of persons. Switzerland’s bilateral agreements with the EU means that it allows freedom of movement of persons, makes a very small net budgetary contribution, but its market access is significantly reduced in the service sector. Finally, the trade deal with Canada (CETA) is less extensive than Switzerland and is essentially restricted to just goods. Canada does not make a budgetary contribution.
.png)
Figure 1: The EU engagement triangle
Note: Net financial contributions are for the year 2015.
Source: NIESR
The UK White Paper proposals are represented in the dotted black line. Market access is similar to Canada and Switzerland and the movement of labour provisions fall well short of Switzerland and only marginally higher than Canada. We have assumed that the UK budgetary contribution to the EU will be small. Legal technicalities aside, our benchmarking exercise suggests that the EU is likely to insist on more generous provisions for the free movement of labour and is also likely to insist on a budgetary contribution.
Impact on the economy
To simulate the effects of a deal as implied by this White Paper, in contrast to the soft Brexit assumed in our August forecast, we have made the following assumptions, which come into effect in the first quarter of 2021, after the transition period ends:
- UK exports: In our soft Brexit central case the UK maintains a close but not complete trading relationship with the EU. Immediately after the end of the transition period, some services e.g. financial services that require passporting rights will no longer be exported to the EU. Over time, trade in services between the UK and the EU will continue to decline as businesses develop new trading relationships. In this alternative scenario we assume that trade between the UK and the EU is reduced by about 40 per cent in the long run, based on estimates by Ebell (2016).
- Business investment: Compared to our soft Brexit scenario, the reduction in trade and increase in uncertainty will likely weigh on investment spending by UK firms and also foreign direct investment. We consider a reduction in FDI of around 12 per cent, which is approximately half the shock implied by HM Treasury (2016) and Dhingra et al. (2017) in the case of a ‘no-deal’ WTO variant.
- Migration: To account for reduced movement of labour within the EU as well as the UK potentially becoming a less attractive destination for migrants, we consider a reduction in net migration of around 50,000 per year compared to the ONS’s principal population projection, which is not based on any Brexit-specific assumptions. This figure is half way between the ONS’s principal and low migration population projections.
- Fiscal: According to the UK government, applying the methodology set out in the Phase 1 agreement implies a financial settlement with the EU of £35-£39 billion. The schedule of payments is yet to be decided although the Phase 1 agreement makes clear that the UK will not be required to make any payments earlier than if the UK had remained a Member State. After the budgetary framework ends in 2020, the UK continues to service its existing commitments and makes a negligible ongoing contribution. Overall, we assume that annual net contributions to the EU reduce by approximately 25 per cent.
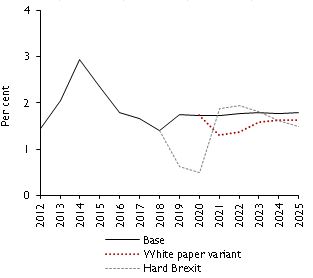
Figure 2 plots the growth rate of real GDP in this scenario, relative to our baseline soft Brexit forecast. We further contrast our findings with a scenario in which negotiations fail and the UK reverts to trade with the EU under WTO rules after March 2019. This builds on earlier work (Hantzsche and Kara, 2018) where we additionally consider the negative impact on economic growth from a reduction in productivity which is a direct consequence of barriers to trade and migration. To be clear, this productivity channel is not included in the effects shown in the figures below.
In the White Paper scenario, we expect output growth to stall in 2021 due to an immediate reduction in services exports to the EU. This would be moderated somewhat by a depreciation of sterling, which cheapens goods and services exported to the EU and the rest of the world but raises the price of imports. We expect this rise in import prices to feed into consumer prices, adding almost 1.4 percentage points to inflation in 2021 (figure 3), dampening domestic demand. Over time the growth rate of real GDP would settle at a lower rate than assumed in our soft Brexit forecast as net migration falls and the productive capacity of the economy grows at a slower rate. This accumulates to a loss of around £500 per person per year compared to the soft Brexit scenario. In the no-deal Brexit scenario, economic growth stalls within a year of exiting and over time losses accumulate to £800 per head and year.
But this is not all. It is worth noting that adding the productivity channel to these estimates has the potential to double the impact on GDP. This in turn would imply a mild recession in the short-run and for the effects to build over time such that per capita output losses amount to £2,000 annually, relative to the soft Brexit case.
|
Figure 2: Baseline real GDP growth and Brexit variants |
Figure 3: Baseline rate of inflation and Brexit variants |
|
|
|
|
Source: NiGEM simulation |
Source: NiGEM simulation |
.JPG)