Inflation Falls, But has it Peaked?
Authors
CPI fell to 10.5% in December from 10.7% in November as we forecast last month. The new month on month inflation was 0.4%, which was outweighed by the drop out from Dec 2021. Whilst month on month Inflation remains well above the historic norms, it is in line with our central forecast in the “very high” scenario.
Month on month inflation was positive for 7 out of 12 types of expenditure and negative for 4. The five main contributors to the change in annual CPI inflation in October were:
- Restaurants and hotels 12 percentage points
- Food and non-alcoholic beverages 06 percentage points
- Transport -0.10 percentage points
- Clothing and footwear -0.07 percentage points
- Recreation and Culture -0.06 percentage points
Month on month inflation was high for August 2021 to May 2022 (with the exception of January). So, as we move forward into 2023, to sustain or increase the headline inflation level, new inflation will need to come forward to replace what drops out from 2021/2. If the new inflation in 2022/3 is higher than the old inflation dropping out from 2021/2, we will see an increase in inflation; if the new inflation is lower, we will see a decrease. The inflationary story for 2023 will be a tug of war between past inflation pulling down with the new inflation pulling up. It seems likely that new inflation will be more in line with the high and very high scenarios, so that we expect a rapid fall in inflation as the large drop outs from past inflation pull down CPI inflation.
The Energy Price Guarantee (EPG) will reduce CPI inflation in 2023 by about 2 percentage points from what it might have been without it.
The future path of inflation will depend on how the Russo-Ukrainian war affects the world economy and the impact of sanctions imposed on Russia by the Western powers. On December 5th, the G7 and EU introduced a price-cap of $60 per barrel on exports of Russian oil. The main mechanism to enforce this is via the provision of insurance and other services by companies in the G7 and EU (details of the UK implementation are detailed in Russian oil services ban). The idea is that when the price-cap is operating, the G7 and EU countries can insure and provide services to expedite the supply of Russian oil and hence avoid a reduction in the world oil supply.
It is too soon to see how well this price-cap is working and if the main customers of Russia (India, Turkey and China) will go along with the price-cap or if the Russians can find alternative providers of insurance and related services required for oil shipment. There are also mixed reports as to the total volume of Russian oil being exported since December 5th. Even before the price-cap, Russia was exporting its oil at a significant discount to its main customers, so the chosen price-cap of $60 may not bind significantly.
The supply of natural gas is highly inelastic in the short run as is the demand. Reductions in Russian supply have led to dramatic rises in price in 2022 and an increase in expenditure and hence the revenue of gas suppliers. Whilst the EPG will reduce CPI inflation in the UK, it will not increase the supply of natural gas, or the real price (net of the subsidy) paid to gas suppliers. This will mean that the EPG makes energy shortages and power cuts more likely as the subsidy will mean that demand will remain high without any corresponding increase in supply. Whether this will lead to rationing by power cuts will depend on the weather in the coming months. Thankfully, the recent mild weather in western Europe has made power cuts less likely. The price of gas has declined significantly in recent months and is currently below the levels seen in 2022; this will significantly lower the cost of the EPG for the UK government and in the longer run lead to downward pressure on inflation. A slowdown in growth in the World as the cost-of-living crisis affects real incomes and leads to a reduction in discretionary consumer expenditure will lead to a decline in some commodity and energy prices across the world. This will mitigate the inflationary pressures somewhat, as we have already seen with petrol prices in the UK.
China’s zero covid policy has had a major impact on the Chinese economy and global supply chains in 2022. However, the Chinese government has ended the zero covid policy in response to protests across the country against the lockdowns. This is a positive development and should lead to a freeing up of world supply chains originating in or passing through China in 2023, which will have a downward effect on inflation.
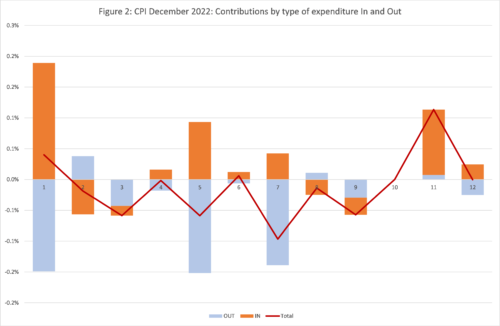
Turning back to the October inflation figures, we can look in more detail at the contributions of the different sectors to overall inflation in Figure 2, with the old inflation dropping out of the annual figure (November-December 2021) shown in blue and the new monthly inflation dropping in (November-December 2022) shown in Brown, using the expenditure weights to calculate CPI. The overall effect is the sum of the two and is shown as the burgundy line.
We can see that for most types of expenditure, there are significant drop-outs from the previous year (the Blue team). The drop-ins are more mixed (the Brown team). The change in inflation is the result of the tug-of-war between the Blue and Brown teams, and this will continue into 2023. December 2022 is a clear win for the Blue team, with big drop outs in several sectors, especially Transport. Food and non-alcoholic beverages has a big drop out but even bigger drop-in.

Extreme Items
Out of over 700 types of goods and services sampled by the ONS, there is a great diversity in how their prices behave. Each month some go up, and some go down. Looking at the extremes, for this month, the top ten items with the highest monthly inflation are:
| Table 1: Top ten items for month-on-month inflation (%), December 2022 | |
| AIR FARES | 61.11 |
| COACH FARES | 53.84 |
| EURO TUNNEL FARES | 17.34 |
| BOOK-NON-FICTION-HARD-COVER | 16.27 |
| SUGAR -GRANULATED-WHITE-PER KG | 12.86 |
| PORTABLE DIGITAL MUSIC PLAYER | 10.09 |
| CHILD’S TRAINERS-SPORTS | 9.96 |
| FRUIT SQUASH, 750ML – 1.5LT | 9.86 |
| CRUMPETS PACK 6-9 SPEC NUMBER | 9.77 |
| TELEVISION 40″ OR LARGER | 9.75 |
Not a good month for travellers, especially those who like to read a book en route. The ten items with the highest negative inflation this month are shown in Table 2.
| Table 2: Bottom ten items for mom inflation (%), December 2022 | |
| CREAM CRACKERS PACK 200G-300G | -10.20 |
| INTERNET BLU-RAY DISC | -10.76 |
| COMPUTER GAME 3 | -10.86 |
| MODEL RD VEHICLE EG HOT WHEELS | -11.39 |
| INTERNET DVDS | -11.89 |
| ELECTRIC TOOTHBRUSH | -16.24 |
| EBOOKS | -18.80 |
| MOBILE PHONE APPLICATIONS | -21.89 |
| ELECTRIC RAZOR | -23.99 |
| SMART SPEAKER | -29.37 |
November was a good month for toiletries and the tech savvy.
In both these tables we look at how much the item price-index for this month has increased since the previous month, expressed as a percentage. These calculations were made by my PhD student at Cardiff University, Yang Li.
Looking Ahead: Ukraine and beyond
We can look ahead over the next 12 months to see how inflation might evolve as the recent inflation “drops out” as we move forward month by month. Each month, the new inflation enters the annual figure and the old inflation from the same month in the previous year “drops out”.[1] However, the invasion of Ukraine by Russia and the western sanctions in response continue to make things uncertain. That said, the invasion and sanctions are certainly going to continue to sustain inflation as we go forward. We have therefore adjusted our four scenarios:
- The “medium” scenario assumes that the new inflation each month is equivalent to what would give us 2% per annum – 0.17% per calendar month (pcm) – which is both the Bank of England’s target and the long-run average for the last 25 years. This is a reference point only, as inflation will be well above this level for the next year.
- The “high” scenario assumes that the new inflation each month is equivalent to 3% per annum (0.25% pcm).
- The “very high” scenario (our central forecast) assumes that the new inflation each month is equivalent to 5% per annum (0.4% pcm). This reflects the inflationary experience of the UK in 1988-1992 (when mean inflation was 0.45%). It also reflects the continuation of the UK average in the second half of 2021. This level of month-on-month inflation would indicate a significant break from the historic behaviour of inflation from 1993-2020.
- The “Sanctions” scenario. This assumes that new inflation per month is 0.8%, equivalent to 10% per annum. This is a high figure relative to recent months, which is unlikely to occur unless geopolitical conditions deteriorate.
We added the “Sanctions” scenario in March 2022 to reflect what we might expect as sanctions and the war itself affect global energy and commodity prices. However, with the fall in energy prices in recent months and levels of month-on-month inflation in recent months, we have decided to show it as a dotted line as it is now less likely.
We have dropped the “low” scenario from previous releases as this is still irrelevant. The “Very high” scenario is the central forecast for now, but it seems likely new inflation will soon fall more in-line with the “high” scenario. The new inflation in December 2022 was in line with the very high scenario (and hence the forecast from last month was correct).
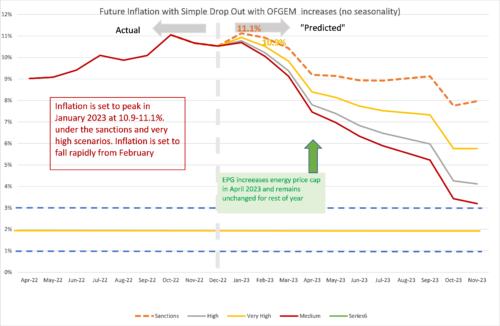
We expect inflation to peak in January 2023, although this depends on the extent of the sales effect that month. The peak may also be smaller than in October 2022.
In all scenarios, there is a rapid fall in inflation from February 2023, which is due to the drop out of the high inflation figures in the corresponding months this year. However, inflation will remain well above 2% for the whole of 2023. There will be a significant change in expenditure weights used to calculate inflation, with energy related expenditures being given more prominence in the “consumer basket” in 2023. If energy prices subside quickly, this might lead to a more rapid fall in the headline CPI inflation rate.
This forecast assumes that geopolitical tensions do not deteriorate. An escalation of the war in Ukraine and direct conflict between Russia and NATO would rapidly worsen the picture for inflation. Looking east, if the rising tensions between the US and China lead to an intensification of the trade war or even open military conflict in the South China sea or Taiwan (Republic of China), world supply chains would be disrupted, and inflation significantly raised. However, the recent local elections in Taiwan, with good results for the opposition KMT party which supports the “one China” policy and opposes the separatist government suggests that the Taiwan issue may calm down for some time. There may be a negotiated settlement to end the war in Ukraine in 2023, which would stabilise the economic situation and lead to a reduction in commodity and energy prices, especially if sanctions on Russia are eased as part of the settlement.
Figure 2: Looking forward to December 2023
[1] This analysis makes the approximation that the annual inflation rate equals the sum of the twelve month-on-month inflation rates. This

For further analysis of current and future prospects for inflation in the UK see:
NIESR Blog: Is the governments energy price plan fit for purpose?
How does Inflation affect the economy when interest rates are near zero? Economics Observatory.
How are rising energy prices affecting the UK economy? Economic Observatory.
NIESR Economic Outlook Summer 2022
approximation ignores “compounding” and is only valid when the inflation rates are low. In future releases I will add on the compounding effect to be more precise at the current high levels of inflation.
Related Blog Posts


Related Projects


Related News
Call for Papers: Lessons From Quantitative Easing & Quantitative Tightening
09 Feb 2024
1 min read

Related Publications
Inflation Differentials Among European Monetary Union Countries: An Empirical Evaluation With Structural Breaks
20 Nov 2023
National Institute Economic Review
The Macroeconomic Effects of Re-applying the EU Fiscal Rules
20 Nov 2023
National Institute Economic Review
Another Look at a Sensible Fiscal Policy for the Sharp Rise in Government Debt
20 Nov 2023
National Institute Economic Review
Monetary Policy: Prices versus Quantities
20 Nov 2023
National Institute Economic Review
Related events
Assessing Cycles and Structural Changes in Markets

Business Conditions Forum