The UK economy since the EU referendum in 6 charts
Rivers of ink will be spent on political commentary on the first anniversary of the EU referendum. We at NIESR decided to use our unique expertise to show the evolution of economy since the vote took place in six charts covering Inflation, wages and consumption, investment, housing market and equities.
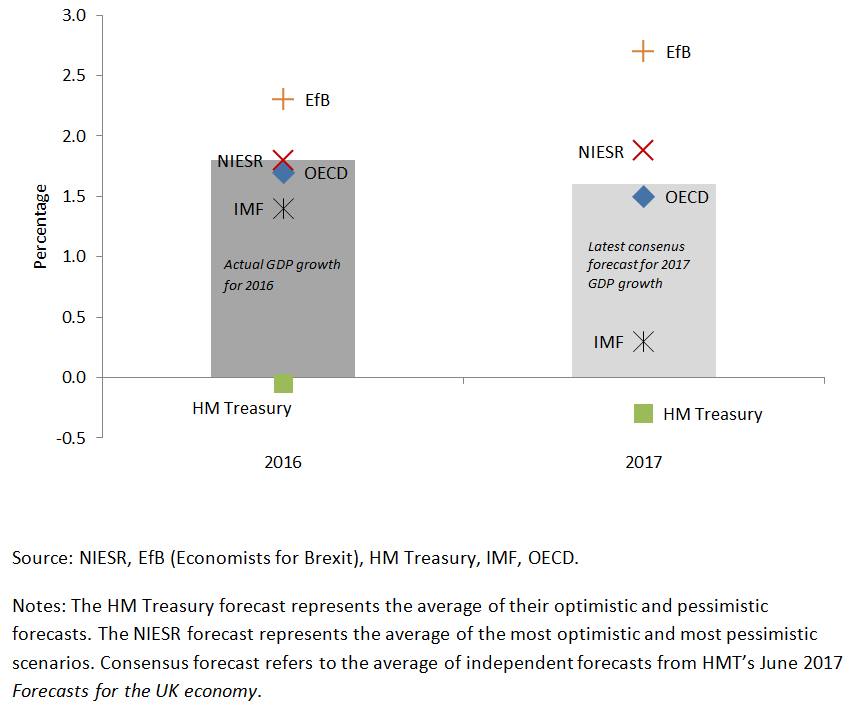
Our final chart compares GDP growth forecasts by different institutions and shows that NIESR’s own Brexit scenario for 2016 turned out to be pretty much on the money. While the outturn for 2016 was not as bad as some had feared the economy has slowed down markedly this year so far, despite robust employment growth.
Authors
Rivers of ink will be spent on political commentary on the first anniversary of the EU referendum. We at NIESR decided to use unique expertise to show the evolution of economy since the vote took place in six charts covering Inflation, wages and consumption, investment, housing market and equities.
Our final chart compares GDP growth forecasts by different institutions and shows that NIESR’s own Brexit scenario for 2016 turned out to be pretty much on the money. While the outturn for 2016 was not as bad as some had feared the economy has slowed down markedly this year so far, despite robust employment growth.
- Chart 1. CPI inflation and effective exchange rate
The depreciation of sterling since the referendum has fed through to import prices, raising consumer price inflation. We expect inflation to rise further, as rising import prices work their way through to consumer prices, peaking in the final quarter of this year.
.PNG)
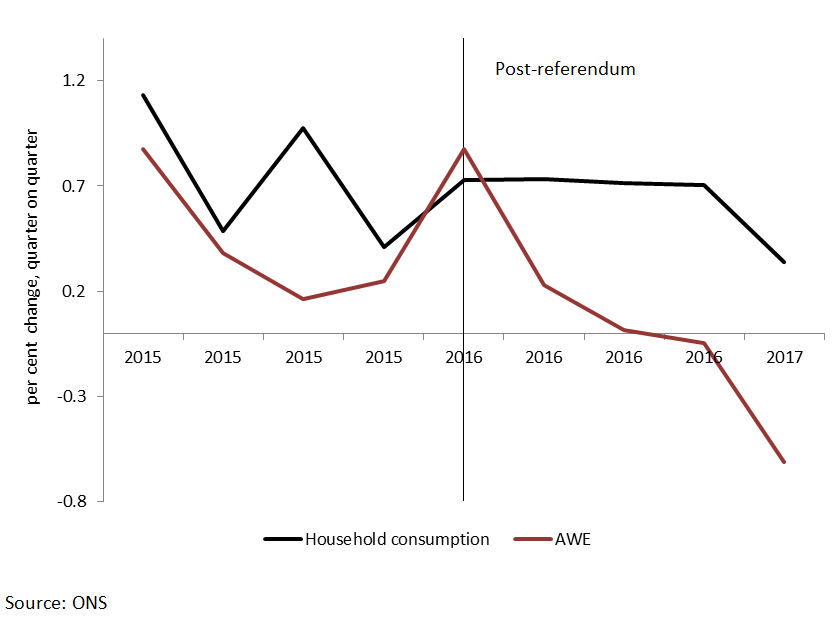
- Chart 2. Average weekly earnings and household consumption
Real household incomes have been squeezed by rising inflation. As a result consumer spending has slowed, but not to the same extent as real wages, implying a fall in the saving ratio. One positive outcome over this period is the robust growth in the number of people employed.
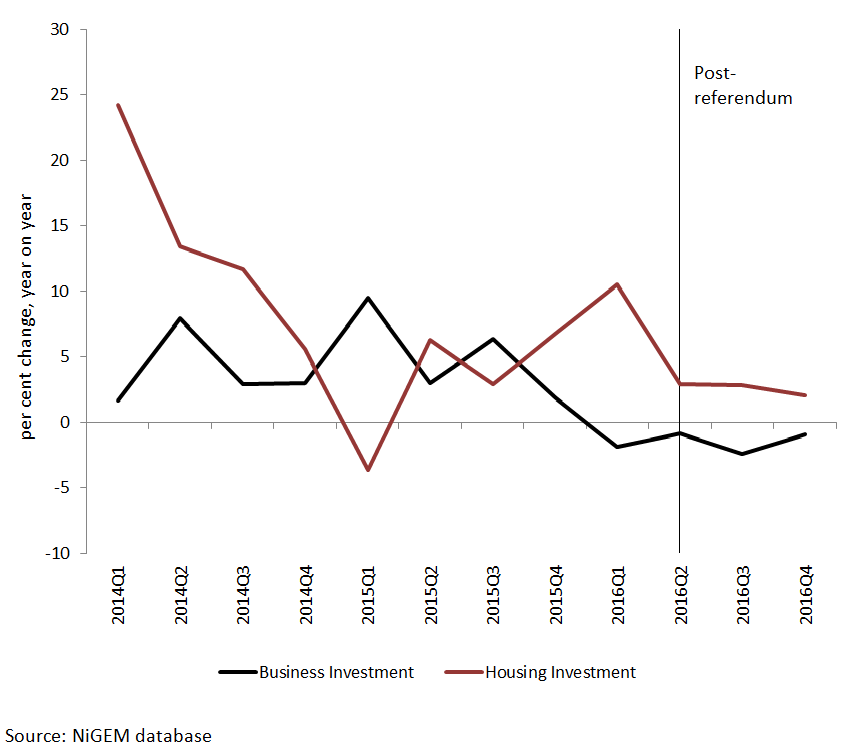
- Chart 3. Business investment and housing investment
Rising uncertainty has weighed on housing and business investment following the referendum. Business investment started to fall before the referendum, suggesting that firms were already acting with caution.
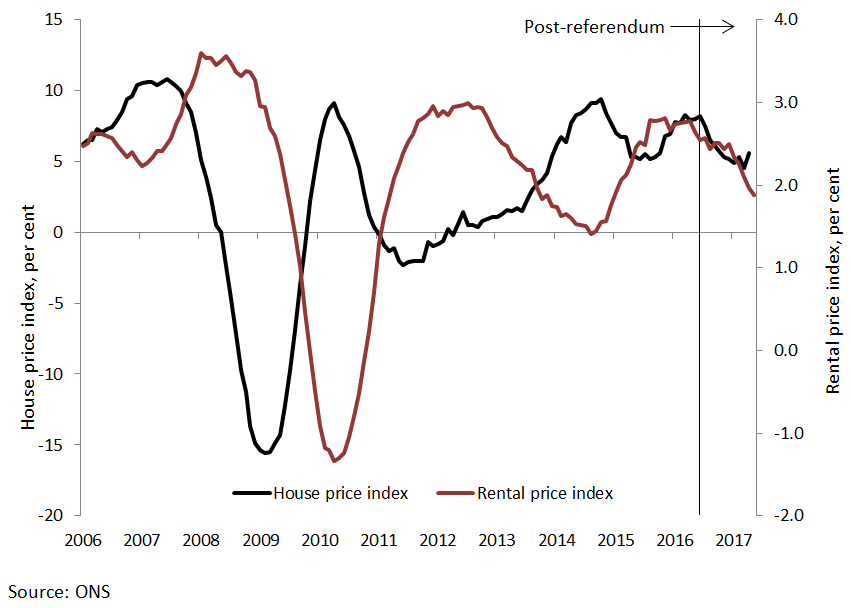
- Chart 4. House price and rental price inflation
Historically, house price and rental price inflation have moved in opposite directions. However, since the start of 2016 they have fallen in tandem. This could be a consequence of an increase in supply, or a decrease in demand due to falling real incomes.
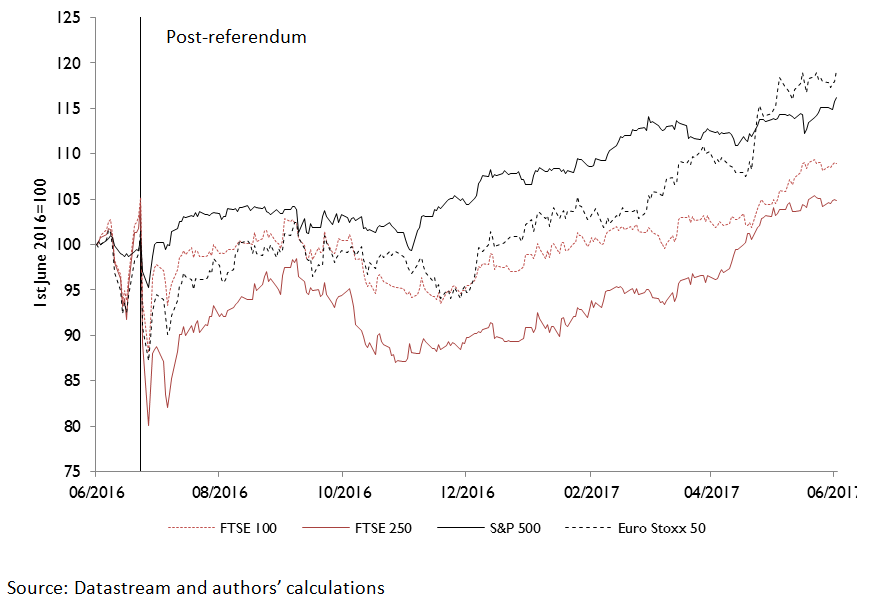
- Chart 5: Equity market prices in US dollars
The performance of the FTSE 100 in US dollar terms (to control for the effects of sterling’s depreciation) has been relatively weak compared to the S&P 500 and Euro Stoxx 50 indices.
- Chart 6: GDP growth, comparison of forecasts
GDP growth has slowed broadly in line with the NIESR Brexit scenario published in NIESR’s May 2016 Review.
Related Blog Posts


Related Projects


Related News

Call for Papers: Lessons From Quantitative Easing & Quantitative Tightening
09 Feb 2024
1 min read

Related Publications
Inflation Differentials Among European Monetary Union Countries: An Empirical Evaluation With Structural Breaks
20 Nov 2023
National Institute Economic Review

The Macroeconomic Effects of Re-applying the EU Fiscal Rules
20 Nov 2023
National Institute Economic Review

Another Look at a Sensible Fiscal Policy for the Sharp Rise in Government Debt
20 Nov 2023
National Institute Economic Review

Monetary Policy: Prices versus Quantities
20 Nov 2023
National Institute Economic Review
Related events
Assessing Cycles and Structural Changes in Markets

Business Conditions Forum