New Methodology Suggests Inflation May Rise to 3.2 Per Cent at the Start of 2025
In Binner et al. (2024) we developed a method for predicting the future path of CPI inflation over a 12-month period by combining the monthly drop outs of past inflation (often called base effects) with a forecast of the future “drop ins” month by month. The forecasts were made using Multi-Recurrent Networks (MRNs), a class of recurrent neural network with a unique sluggish state-based memory mechanism, which were trained on past data. The data used was month-on-month (“monthly”) inflation, the CPI index itself, along with an ensemble of other predictors: 10 year interest rates, real GDP, PPI index for industrial output, the yield on 10-year UK gilts, sterling effective exchange rate and the adjusted price dual of the Divisia money index.
In this blog we will update the “simple” MRN using just monthly inflation and CPI price index levels. This can be done each month after the new CPI inflation data come out. In comparison to Binner et al. (2024) which used data up to and including December 2023, here we use the CPI data up to and including March 2024. The “complex” MRN will also be updated, but less frequently as the data becomes available.
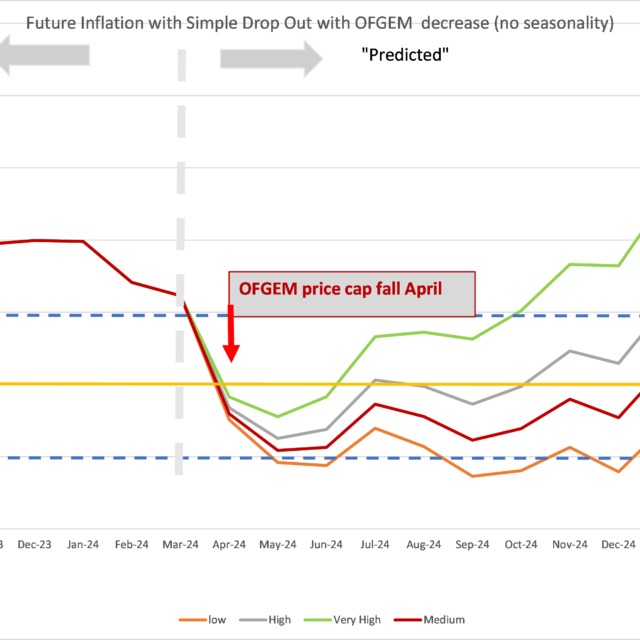
So, what does the updated simple MRN predict for the next 12 months? This is shown in the chart below, with the 2 per cent target rate of inflation being shown by the dotted line.
The general story is that inflation will fall below 2 per cent in April, reaching as low as 1 per cent in June. However, after that there is a “bounce-back” of inflation, which rises more-or-less steadily until March 2025 when it hits 3.2 per cent. The average monthly inflation over the year to March 2025 is 0.27 per cent, which represents an annualised rate of 3.2 per cent which of course corresponds to the predicted annual rate for March 2025.
The simple MRN is therefore telling us that inflation has not “gone away” and indeed inflationary pressures will remain as we move forward through the next year into 2025. Note that the simple MRN in Binner et al. (2024) predicted a lower trajectory for inflation. The high month-on-month inflation of February and March 2024 (both at 0.6 per cent or an annualized rate of over 7 per cent) has caused the simple MRN to raise its forecast trajectory.
However, things may be worse than this prediction and it all depends on the April inflation figure, which will be released on 22 May. The MRN predicts a very large fall in inflation from 3.2 per cent in March to just 1.4 per cent in April, a change of 1.8 percentage points. Most of this fall is due to the “drop out” of 1.2 percentage points in April 2023. However, when we add in the effect of the OFGEM price cap fall in April 2024 the MRN predicts monthly inflation for March to April 2024 will be -0.6 per cent. Whilst this is not unreasonable, what if inflation falls closer to 2 per cent instead? This will have the implication that the “predicted” line will be shifted upwards by around 0.6 per cent. The June “low” would become 1.6 per cent and the March 2025 figure would be around 3.8 per cent. Whether inflation is 3.2 per cent or 3.8 per cent in March 2025, it means that the low inflation for the second quarter of 2024 will mean that inflationary pressures are “down but not out”.
The complex multivariate MRN in Binner at al. (2024) predicted a much lower level of inflation than the simple MRN. We will update the complex MRN as soon as the data allows to see if this remains the case with the new data.
In terms of MPC decisions, the spectre of inflation rising to 3.2 per cent or even 3.8 per cent in the first quarter of 2025 does not encourage any interest rate cuts in 2024. The added ingredient of geopolitical uncertainties (Ukraine, the Straits of Hormuz, and the South China Sea) are all upside risks for inflation which will make cuts even less likely.


