CPI Inflation Rose in December 2023, But is Likely to Fall Below 3 per cent by May
Authors
CPI Inflation was 4.0 per cent in December 2023, up slightly from 3.9 per cent in November. New month on month inflation for November to December 2023 came in at 0.42 per cent, whilst the old inflation dropping out was 0.37 per cent, given a net increase in CI inflation of 0.05per cent which after rounding gave an increase in the headline of 0.1 per cent (the actual increase to two decimal places was from 3.94 to 3.95 per cent, but the ONS rounds to one decimal place, hence the headline rise from 3.9 to 4.0 per cent).
The main contributions to the change in inflation were:
| Food and Non-Alcoholic Beverages | -0.14 percentage points |
| Alcohol and Tobacco | 0.11 percentage points |
| Transport | 0.06 percentage points |
| Recreation and Culture | 0.05 percentage points |
| Miscellaneous Goods and services | -0.05 percentage points |
The increase in Tobacco duty in the November Autumn Statement lay behind most of the contribution of Alcohol and Tobacco.
We can look in more detail at the contributions of the different sectors to overall inflation in Figure 2, with the old inflation dropping out of the annual figure (November-December 2022) shown in burgundy and the new monthly inflation dropping in (November-December 2023) shown in black, using the expenditure weights to calculate CPI. The overall effect is the sum of the two and is shown as the blue line.
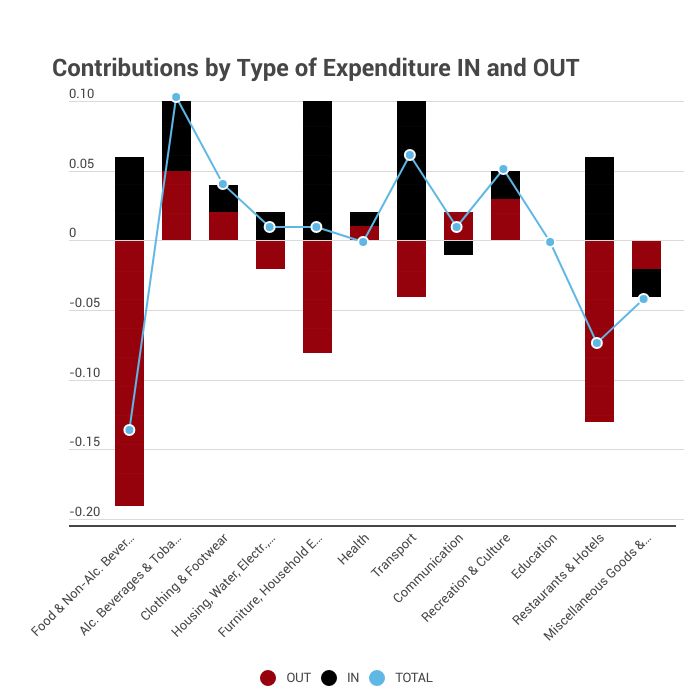
Figure 2
We can see that there is positive black “new” inflation in 9 out of 12 sectors, indicating inflationary pressures remain widespread. The burgundy “old” inflation is negative in 7 out of 12 sectors, as the old inflation drops out. Overall, the black team dominates when the blue line is above zero in 7 out of 12 sectors, with the burgundy team dominates in 3 sectors with a “draw” in two. The prices of Food and Non-Alcoholic Beverages continue to increase across most types of food.
Looking Ahead
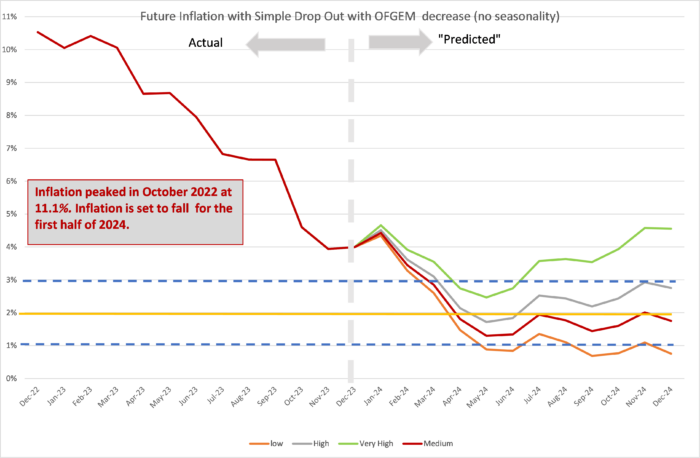
We can look ahead over the next 12 months to see how inflation might evolve as the recent inflation “drops out” as we move forward month by month. Each month, the new inflation enters the annual figure and the old inflation from the same month in the previous year “drops out”.[1] Previously we ended the “low inflation” scenario, but we have now reintroduced it in response to two recent months with near zero month on month inflation. We have also dropped the “High inflation persistence” scenario as now unlikely unless geopolitical factors deteriorate significantly. We depict the following scenarios for future inflation dropping in:
- The “medium” scenario assumes that the new inflation each month is equivalent to what would give us 2 per cent per annum or 0.17 per cent per calendar month (pcm) – which is both the Bank of England’s target and the long-run average for the last 25 years.
- The “high” scenario assumes that the new inflation each month is equivalent to 3 per cent per annum (0.25 per cent pcm). This is now the central forecast.
- The “very high” scenario assumes that the new inflation each month is equivalent to 5 per cent per annum (0.4 per cent pcm). This reflects the inflationary experience of the United Kingdom in 1988-1992 (when mean monthly inflation was 0.45 per cent).
- The “low” scenario assumes inflation each month is equivalent to 1% per annum (0.08 per cent pcm).
Aristotle said “One swallow does not a summer make, nor one fine day”: the fact that 1-month inflation was zero in both October and November 2023 has not meant that inflationary pressures have disappeared. Monthly inflation is a very noisy series and in December we see the rate back at 0.4 per cent, which was the central forecast for most of 2023.
In the three months to November, we still saw high annual wage growth of 6.6 per cent (excluding bonuses) as wages continued to catch up with past inflation. We can expect this to continue and put upward pressure on prices, particularly in the service sector. The inflation rate of services remains high at 6.4% with the 1-month inflation rate at 0.9% (an annualised rate of 18 per cent), whilst core inflation (excluding food and energy) remains at an annual rate of 5.1 per cent and a 1-month rate of 0.6 per cent. These factors indicate that inflationary pressures are likely to persist well into 2024. However, the dropping out of the high inflation rates from 2023 will tend to dominate and drive down inflation for the first half of 2024 despite these persisting inflationary pressures.
Therefore, we are shifting our focus for our central case from the “very high” to the “high” scenario, although the future will probably lie between the two. If we track the “high” scenario, we see inflation falling to 2 per cent by May 2024 (the fall is largely driven by the large drop-outs from early 2023), before rising to 3 per cent from July 2024 onwards. The “very high” scenario sees inflation dropping to 3 per cent by May and then back up to 4 per cent from July onwards. Under both scenarios, we see inflation remaining above target into late 2024. In order for inflation to drop to target and remain there, we would need to see 1-month inflation following the “medium” scenario and coming in at 0.17% (on average). We will just have to see how the figures come in in the coming months to guide us as to the best scenario to take forward.
The main uncertainty in the next few months is what happens in January. In January 2023 there was a very big sales effect that drops out in January 2024, which will tend to increase inflation. January is very hard to predict, as the sales effect varies (and can indeed be spread into the December figures with early pre-Christmas sales). In our forecast, we have included a modest January sales effect of -0.3 to offset the “drop in” of 0.56% inflation from the previous January. The new OFGEM price cap for January has changed little, with a slight increase from £1,834 to £1,928 per year which will have a negligible effect on inflation.
This forecast assumes that geopolitical tensions do not deteriorate. Direct conflict between Russia and NATO would rapidly worsen the picture for inflation. Looking east, if the rising tensions between the United States and China lead to an intensification of the trade war or even open military conflict in the South China Sea or Republic of China (Taiwan), world supply chains would be disrupted, and inflation significantly raised, to levels far higher than seen in 2022. The presidential election victory of Lai Ching-te of the pro-independence Democratic Progressive Party is likely to heighten tensions in this region.
The current conflict around Israel-Palestine will not in itself have a major effect on inflation but looks likely to spread to other parts of the middle-east. Already the Houthi’s have disrupted trade through the Red Sea and the Suez Canal. If Iran becomes involved and the straits of Hormuz are also blocked, then this will have a major effect on the supply of goods and particularly oil and LNG (liquified natural gas) which would cause inflationary pressures around the world and particularly in Europe and the United Kingdom.
For further analysis of current, and future, prospects for inflation in the United Kingdom see:
How does Inflation affect the economy when interest rates are near zero? Economics Observatory.
How are rising energy prices affecting the UK economy? Economic Observatory.
[1] This analysis makes the approximation that the annual inflation rate equals the sum of the twelve month-on-month inflation rates. This approximation ignores “compounding” and is only valid when the inflation rates are low. In future releases I will add on the compounding effect to be more precise at the current high levels of inflation.
Related Blog Posts


Related Projects


Related News


Why it’s not worth worrying that the UK has technically entered a recession
26 Feb 2024
4 min read
Related Publications

Recessionary Pressures Receding in the Rearview Mirror as UK Economy Gains Momentum
12 Apr 2024
GDP Trackers
Related events

Summer 2023 Economic Forum

Spring 2023 Economic Forum

Winter 2023 Economic Forum

Autumn 2022 Economic Forum

Summer 2022 Economic Forum

Spring 2022 Economic Forum

Winter 2022 Economic Forum
