Fall in Ofgem Price Cap Helps to Slow Inflation
Authors
CPI Inflation was 6.8 per cent in July, down from 7.9 per cent in June. This was largely due to the fall in the OFGEM price cap (from £2,500 to £2,074), which was large enough to cause the level of prices to fall, with July prices being 0.4 per cent lower than June. Without the OFGEM price cap reduction, inflation would still have fallen, but by much less (to about 7.3 per cent). This fall in domestic energy prices reflects the fall in wholesale prices since the second half of 2022, which have gone back to where they were in April 2022. However, energy prices are unlikely to fall back further.
There were two big contributors to the change in inflation:
Housing and energy -0.69 percentage points
Food and Non-Alcoholic Beverages -0.26 percentage points
The negative contribution of Food was largely from the drop-out of high inflation in June-July 2022, although the new Food inflation for July was small. Across the other categories of expenditure, most saw overall negative contributions except for Health and Restaurants and Hotels.
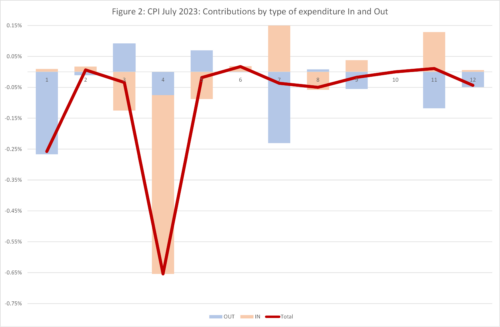
We can look in more detail at the contributions of the different sectors to overall inflation in Figure 2, with the old inflation dropping out of the annual figure (June-July 2022) shown in blue and the new monthly inflation dropping in (June-July 2023) shown in Brown, using the expenditure weights to calculate CPI. The overall effect is the sum of the two and is shown as the burgundy line.
We can see that across different types of expenditure there is a mixture of stories, but in most cases the dropouts and drop-ins are pulling in different directions. For example, in Clothing and Footwear, the drop-out is pulling up, whilst the new inflation is negative. The opposite is true for Transport, where the new inflation is positive and the drop-out negative. In most sectors the two forces are fairly balanced with only modest overall inflation, which in most sectors is slightly negative. Even without the effect of the OFGEM price cap reduction, inflation would have fallen, which is good news as it indicates that inflationary pressures are abating.
![]()
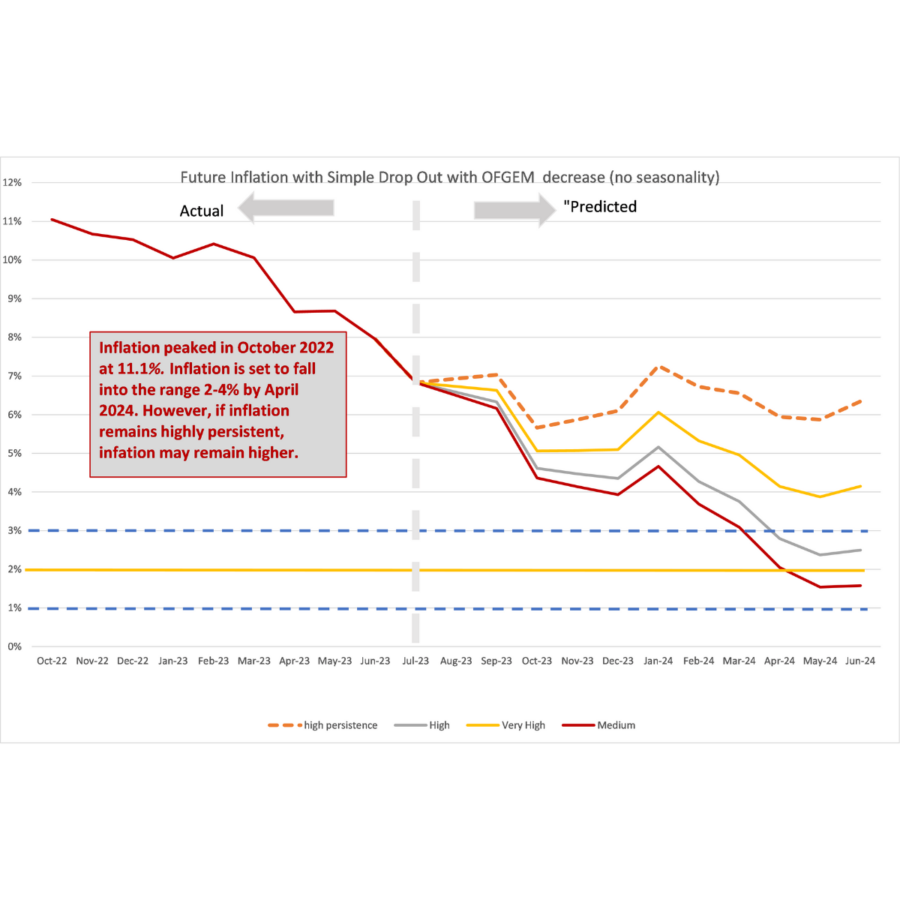
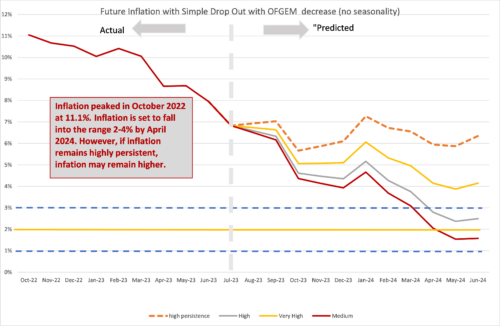
Looking Ahead.
We can look ahead over the next 12 months to see how inflation might evolve as the recent inflation “drops out” as we move forward month by month. Each month, the new inflation enters the annual figure and the old inflation from the same month in the previous year “drops out”.[1] Previously we ended the “Sanctions scenario” introduced last March in response to the invasion of Ukraine by Russia. However, since the new month on month inflation became high again in Feb-May 2023, we have re-introduced the Sanctions scenario, but renamed it the “high persistence” scenario since the causes have little to do with war and sanctions but rather domestic wage-price dynamics. We depict the following scenarios for future inflation dropping in:
- The “medium” scenario assumes that the new inflation each month is equivalent to what would give us 2 per cent per annum – 0.17 per cent per calendar month (pcm) – which is both the Bank of England’s target and the long-run average for the last 25 years.
- The “high” scenario assumes that the new inflation each month is equivalent to 3 per cent per annum (0.25 per cent pcm).
- The “very high” scenario assumes that the new inflation each month is equivalent to 5 per cent per annum (0.4 per cent pcm). This reflects the inflationary experience of the UK in 1988-1992 (when mean monthly inflation was 0.45 per cent). It also reflects the continuation of the UK average in the second half of 2021. This level of month-on-month inflation would indicate a significant break from the historic behaviour of inflation from 1993-2020.
- The “high persistence” scenario assumes new month on month inflation of 0.6 per cent, which is equivalent to an annual rate of 7.4 per cent.
In recent months our central forecast was the “very high scenario”. However, as inflationary pressures are persisting, we believe that inflation will be in the range between this and the “high persistence” scenario. The high figures for wage growth published by the ONS on August 15th indicate that annual wage inflation is running at 7.8 per cent, which will put upwards pressure on the service sector moving forwards and is likely to make inflation fall more slowly moving forward.
Whilst food price inflation seems to be falling (although price levels will remain high), the prospects for food price inflation have deteriorated with the decision of Russia to withdraw from the Black Sea grain agreement brokered by Turkey and the United Nations last year to facilitate exports of grain and fertiliser from Ukraine and Russia through the Black Sea. This has already led to an increase in Wheat prices which will feed through to food prices in the shops in due course if not resolved.
The fall of the energy price-cap back to its level in April 2022 (just over £2,000) has played a major effect in reducing current inflation, reflecting the fall in energy prices from their peak last year. However, energy prices are unlikely to fall further and may rise again if the winter is cold. Liquified Natural Gas (LNG) is significantly more expensive than the piped gas which it has replaced, and we are not ging back to the levels of domestic energy prices enjoyed prior to 2021, when the price cap was around £1,000.
This forecast assumes that geopolitical tensions do not deteriorate. Direct conflict between Russia and NATO would rapidly worsen the picture for inflation. Looking east, if the rising tensions between the United States and China lead to an intensification of the trade war or even open military conflict in the South China Sea or Republic of China (Taiwan), world supply chains would be disrupted, and inflation significantly raised, possibly to levels far higher than seen in 2022.
For further analysis of current and future prospects for inflation in the UK see:
How does Inflation affect the economy when interest rates are near zero? Economics Observatory.
How are rising energy prices affecting the UK economy? Economic Observatory.
[1] This analysis makes the approximation that the annual inflation rate equals the sum of the twelve month-on-month inflation rates. This approximation ignores “compounding” and is only valid when the inflation rates are low. In future releases I will add on the compounding effect to be more precise at the current high levels of inflation.
Related Blog Posts


Related Projects


Related News


Why it’s not worth worrying that the UK has technically entered a recession
26 Feb 2024
4 min read
Related Publications

Recessionary Pressures Receding in the Rearview Mirror as UK Economy Gains Momentum
12 Apr 2024
GDP Trackers
Related events

Summer 2023 Economic Forum

Spring 2023 Economic Forum

Winter 2023 Economic Forum

Autumn 2022 Economic Forum

Summer 2022 Economic Forum

Spring 2022 Economic Forum

Winter 2022 Economic Forum
