Inflation Expected to Fall Below Two Per Cent by April
Authors
CPI Inflation was 4.0 per cent in January 2024, the same as the previous month. New month on month inflation for December 2023 to January 2024 came in at -0.58 per cent, whilst the old inflation dropping out from December 2022 to January 2023 was -0.56 per cent, given a net decrease in CPI inflation of 0.02 percentage points which after rounding gave the figure of 0.0 change. It is really a tale of two big Januarys. The January “Sales” effect of 2023 was a big one; January 2024 was just as big. The two larger than normal January Sales effects cancel out to give no change in the headline annual CPI inflation figure.
However, whilst the headline remained constant, there was much variability among inflation rates for individual types of expenditure underlying the CPI figure. The main contributions to the change in inflation can be divided into two groups, those with significant positive contribution and those with a negative contribution.
Increasing inflation were:
| Housing and household services | 0.18 percentage points |
| Transport | 0.11 percentage points |
| Miscellaneous Goods and Services | 0.03 percentage points |
Decreasing inflation were:
| Furniture and household goods | -0.13 percentage points |
| Food and Non-alcoholic beverages | -0.11 percentage points |
| Clothing and Footwear | -0.06 percentage points |
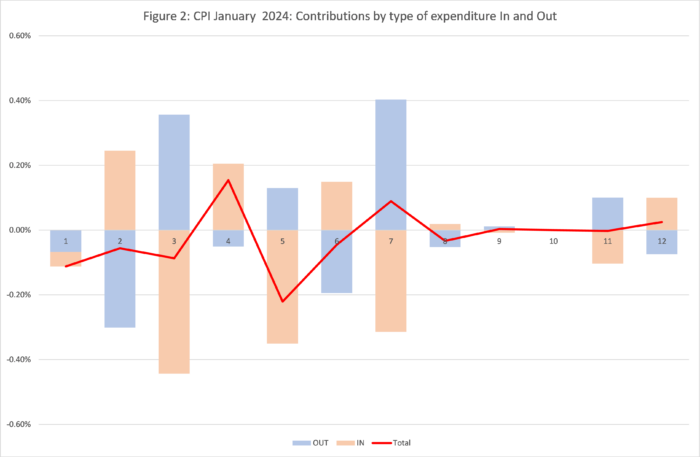
As we can see, there are big plusses and minuses which cancel out overall. We can look in more detail at the contributions of the different sectors to overall inflation in Figure 2, with the old inflation dropping out of the annual figure (December 2022-January 2023) shown in blue and the new monthly inflation dropping in (December 2023-January 2024) shown in brown, using the new January 2024 expenditure weights to calculate CPI. The overall effect is the sum of the two and is shown as the burgundy line.
We can see that there is positive brown, i.e., “new”, inflation in five out of 12 sectors, with prices falling significantly in Food and non-alcoholic beverages, Clothing and footwear, Furniture etc, Transport and Restaurants and hotels. New inflation was positive in Alcohol and tobacco, Housing water electricity etc, Health and Miscellaneous goods and services. The old inflation dropping out gives an upwards push in Clothing and footwear, Transport and Furniture and household goods, and a downward push in Alcohol and tobacco and Health. We thus see a different story across the different sectors and less of a consistent story of the tug-of-war between new and old inflation.
![]()
Extreme Items
Out of over 700 types of goods and services sampled by the ONS, there is a great diversity in how their prices behave. Each month some go up, and some go down. Looking at the extremes, for this month, the top 10 items with the highest monthly inflation are:
| Table 1: Top Ten Items for Month-on-Month Inflation (%), Jan 2024 | |
| Cream Liquer 70cl-1lt 14-20% | 24.54 |
| Smart Speaker | 18.98 |
| Computer Game Downloads | 18.05 |
| Premium Potato Crisps/Chips | 15.36 |
| Computer Software | 14.36 |
| Private Health Care 1 | 13.96 |
| Private Health Care 3 | 13.96 |
| Hair Gel 150-200ml | 11.98 |
| Action Camera | 10.91 |
| Brandy 70cl Bottle | 10.18 |
January was not a good month for those who watch TV with a glass of Baileys and a packet of crisps.
The 10 items with the highest negative inflation this month are shown in Table 2.
| Table 2: Bottom ten items for mom inflation (%), Jan 2024 | |
| Hotel 1 Night Price | -5.99 |
| Womens Short Sleeve Formal Top | -6.10 |
| Book-Non-Fiction-Hard-Cover | -6.67 |
| Airport Parking | -6.67 |
| Girls Fashion Top 12-13 Years | -6.75 |
| Sports Bra / Crop Top | -7.59 |
| Coach Fares | -8.13 |
| Euro Tunnel Fares | -8.46 |
| Golf Green Fees | -10.85 |
| Air Fares | -19.01 |
January was a great month to travel abroad or go out for a bracing round of golf.
In both these tables we look at how much the item price-index for this month has increased since the previous month, expressed as a percentage. These calculations were made by my former PhD student at Cardiff University, Dr Yang Li who has returned to Shanghai.
Looking Ahead
We can look ahead over the next 12 months to see how inflation might evolve as the recent inflation “drops out” as we move forward month by month. Each month, the new inflation enters the annual figure and the old inflation from the same month in the previous year “drops out”.[1] Previously we ended the “low inflation” scenario but have reintroduced it in response to two recent months with near zero month on month inflation. We have also dropped the “High inflation persistence” scenario as it now looks unlikely unless geopolitical factors deteriorate significantly. We depict the following scenarios for future inflation dropping in:
- The “medium” scenario assumes that the new inflation each month is equivalent to what would give us two per cent per annum or 0.17 per cent per calendar month (pcm) – which is both the Bank of England’s target and the long-run average for the last 25 years.
- The “high” scenario assumes that the new inflation each month is equivalent to three per cent per annum (0.25 per cent pcm). This is now the central forecast.
- The “very high” scenario assumes that the new inflation each month is equivalent to five per cent per annum (0.4 per cent pcm). This reflects the inflationary experience of the United Kingdom in 1988-1992 (when mean monthly inflation was 0.45 per cent).
- The “low” scenario assumes inflation each month is equivalent to one per cent per annum (0.08 per cent pcm).
Inflation has been even noisier than usual in recent months. In October and November 2023 month on month inflation was zero, and then quite high at 0.4 per cent in December. January 2024 was large and negative as in the previous year. However, in 2023 we saw a “bounce back” of inflation with inflation higher than normal in February 2023 at 1.1 per cent. This makes it hard to pick which scenario is most likely. Previously we had followed the “very high” or “high” scenarios. We think that the new figures are likely to come in on average somewhere between the two in the coming months. However, there is a special factor: in April there is likely to be a fall in the OFGEM price cap resulting in a downward push of 0.65 percentage points (plus the drop out of the April 2023 increase in the price-cap). Overall, there will be a blue “drop out” reducing inflation by 1.2 per cent and the new OFGEM drop in of -0.65 per cent, so these two factors will lead to an overall fall in the headline inflation of 1.85 per cent less the “new inflation” in the various scenarios. In all scenarios, we see the high inflation from the first two quarters of 2023 dropping out and this will drag CPI inflation down until May 2024.
The latest ONS data (covering the three months to December 2023) suggest that wages are growing at 6.2 per cent (excluding bonuses). That is, wage growth remains high as wages continue to catch up with past inflation. We can expect this to continue and put upward pressure on prices, particularly in the service sector. The inflation rate of services remains high at 6.5 per cent whilst core inflation (excluding food and energy) remains at 5.1 per cent. These factors indicate that inflationary pressures are likely to persist well into 2024. However, the dropping out of the high
[1] This analysis makes the approximation that the annual inflation rate equals the sum of the twelve month-on-month inflation rates. This approximation ignores “compounding” and is only valid when the inflation rates are low. In future releases I will add on the compounding effect to be more precise at the current high levels of inflation.
Related Blog Posts


Related Projects


Related News


Why it’s not worth worrying that the UK has technically entered a recession
26 Feb 2024
4 min read
Related Publications

Recessionary Pressures Receding in the Rearview Mirror as UK Economy Gains Momentum
12 Apr 2024
GDP Trackers
Related events

Summer 2023 Economic Forum

Spring 2023 Economic Forum

Winter 2023 Economic Forum

Autumn 2022 Economic Forum

Summer 2022 Economic Forum

Spring 2022 Economic Forum

Winter 2022 Economic Forum
