Inflation Set to Fall Further in July as New Ofgem Price Cap Kicks In
Authors
CPI inflation was 7.9 per cent in June (7.95 per cent to two decimal places), down from 8.7 per cent in May. This is a significant drop and reflects the large drop-out of 0.8 per cent from the May-June 2022 and the small drop-in of only 0.1 per cent in May-June 2023, leading to the overall drop of 0.8 per cent in the headline. The new inflation of only 0.1 per cent would be equivalent to an annual rate of 1.5 per cent if sustained for 12 months, and so represents a level below the Bank of England target of 2 per cent. If inflation continues at this lower level, we can see a rapid fall in inflation.
The good news is that the Ofgem Energy Price Cap will fall significantly on 1 July. This will result in a fall in average household energy bills from £2,500 (the level supported by the government’s Energy Price Guarantee) to £2,074. This will have a significant impact on the July inflation figures, reducing CPI inflation by 0.97 percentage points. This fall in domestic energy prices reflects the fall in wholesale prices since the second half of 2022. However, prices are unlikely to fall back to their 2021 levels when the cap was about £1,100. This effect alone could take inflation to below 7% in July.
However, the new inflation each month is highly variable, so we would need a few months of lower monthly inflation after July to be confident that headline CPI inflation will return to more normal levels, and inflation still has a long way to go to the target of 2 per cent. Wages are still rising rapidly on average, which will generate price increases in many sectors as we move forward, particularly services.
However, the effect of the fall in June and the likely fall in July mean that by April 2024 we can reasonably expect inflation to be in the range 2-4% which is good news for the Bank or England.
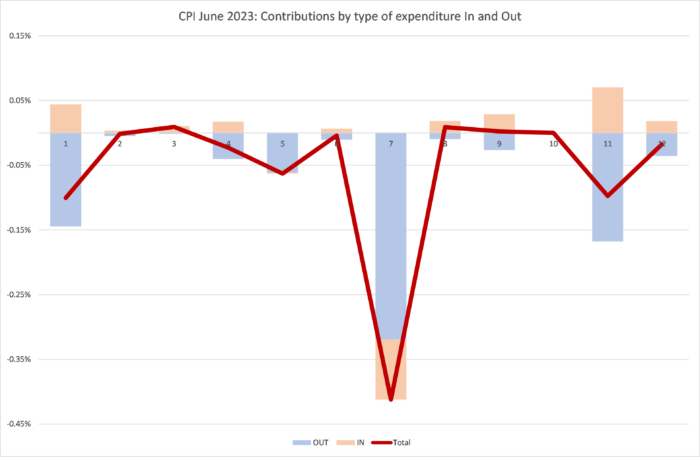
The main contributors to the change in inflation were (in percentage points)
Transport -0.42 pp
Food and Non-Alcoholic Beverages -0.11 pp
Furniture and Household Goods -0.07 pp
Restaurants and Hotels -0.07 pp
The driving force of the negative contributions is mainly the big drop-outs from May-June 2022. For example, for Food and Non-Alcoholic Beverages monthly inflation in June 2022 was 0.14 per cent and in June 2023 0.04 per cent leading to the overall fall of 0.11 percentage points (after rounding). Transport is an exception, with both the old and new inflation reinforcing each other and leading to the large overall effect.
The negative contribution of food does not mean food prices were falling, but rather that the increase in the month to June 2023 was smaller than in the month to June 2022. Food prices continue to increase.
The tug of war between new inflation dropping in and the old inflation dropping out has been much tougher than we had expected. The fall in inflation has been less than expected, as the new inflation has been much larger than expected with the exception of this month (June 2023). Looking forward, the inflation dropping out in July to September will be smaller, so that if the new inflation dropping in remains as high as it was in February to May 2023, we may even see an increase in inflation over the summer. We have reintroduced the old “sanctions scenario” into our forecast but renamed it the “high persistence” scenario.
We can look in more detail at the contributions of the different sectors to overall inflation in Figure 2, with the old inflation dropping out of the annual figure (May-June 2022) shown in blue and the new monthly inflation dropping in (May-June 2023) shown in Brown, using the expenditure weights to calculate CPI. The overall effect is the sum of the two and is shown as the burgundy line.
We can see that for most types of expenditure, there are big dropouts from the previous year (the Blue team) and big drop-ins (the Brown team) in many sectors. Overall, the Blue team predominated and the drop-outs exceeded the drop-ins, with inflation falling from 8.68 per cent to 7.95 per cent, which is 0.73 pp. The rounding of 8.68 to 8.7 per cent and 7.95 to 7.9 per cent gives the published headline reduction of 0.8 pp (the ONS reports inflation figures to just one decimal place, so rounding matters when we interpret the figures).
![]()
Looking Ahead
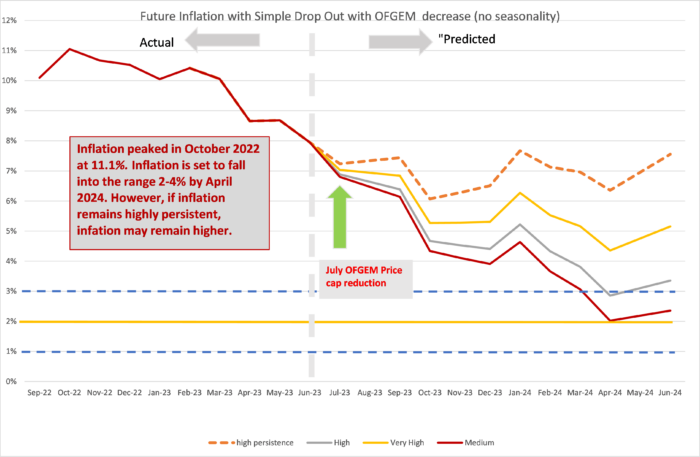
We can look ahead over the next 12 months to see how inflation might evolve as the recent inflation “drops out” as we move forward month by month. Each month, the new inflation enters the annual figure and the old inflation from the same month in the previous year “drops out”.[1] Previously we ended the “Sanctions scenario” introduced last March in response to the invasion of Ukraine by Russia. However, since the new month on month inflation became high again in Feb-May 2023, we have re-introduced the Sanctions scenario, but renamed it the “high persistence” scenario since the causes have little to do with war and sanctions but rather domestic wage-price dynamics. We depict the following scenarios for future inflation dropping in:
- The “medium” scenario assumes that the new inflation each month is equivalent to what would give us 2 per cent per annum – 0.17 per cent per calendar month (pcm) – which is both the Bank of England’s target and the long-run average for the last 25 years. This is a reference point only, as inflation will be well above this level for the next year.
- The “high” scenario assumes that the new inflation each month is equivalent to 3 per cent per annum (0.25 per cent pcm).
- The “very high” scenario assumes that the new inflation each month is equivalent to 5 per cent per annum (0.4 per cent pcm). This reflects the inflationary experience of the UK in 1988-1992 (when mean monthly inflation was 0.45 per cent). It also reflects the continuation of the UK average in the second half of 2021. This level of month-on-month inflation would indicate a significant break from the historic behaviour of inflation from 1993-2020.
- The “high persistence” scenario assumes new month on month inflation of 0.6 per cent, which is equivalent to an annual rate of 7.4 per cent.
In recent months our central forecast was the “very high scenario”. However, as inflationary pressures are persisting, we believe that inflation will be in the range between this and the “high persistence” scenario. The low figure for monthly inflation between May and June at 0.1 per cent is below the medium scenario, but we need to see how inflation develops to see if there is a sustained reduction in inflationary pressure as we move forward.
We dropped the “low” scenario from releases prior to the Russian invasion of Ukraine as this is still likely to be irrelevant for 2023. In all scenarios, there is a rapid fall in inflation from February 2024, which is due to the drop out of the high inflation figures in the corresponding months this year. However, inflation will remain well above 2 per cent for the whole of 2023.
The fall in the Ofgem EPC represents a significant reduction in domestic energy prices. The 2023 CPI weights on domestic gas and electricity are high, reflecting the high share of expenditure in 2022: the combined weight was 4.7 per cent as opposed to 3.4 per cent the year previously. This means that the drop in the price cap will have an effect of about 0.97 percentage points on the July inflation figures.
However, against this the prospects for food price inflation have deteriorated with the decision of Russia to withdraw from the Black Sea grain agreement brokered by Turkey and the United Nations last year to facilitate exports of grain from Ukraine and Russia through the Black Sea. This has already led to an increase in Wheat prices.
This forecast assumes that geopolitical tensions do not deteriorate. Direct conflict between Russia and NATO would rapidly worsen the picture for inflation. Looking east, if the rising tensions between the US and China lead to an intensification of the trade war or even open military conflict in the South China sea or Republic of China (Taiwan), world supply chains would be disrupted, and inflation significantly raised, possibly to levels far higher than seen in 2022.
[1] This analysis makes the approximation that the annual inflation rate equals the sum of the twelve month-on-month inflation rates. This approximation ignores “compounding” and is only valid when the inflation rates are low. In future releases I will add on the compounding effect to be more precise at the current high levels of inflation.
For further analysis of current and future prospects for inflation in the UK see:
How does Inflation affect the economy when interest rates are near zero? Economics Observatory.
How are rising energy prices affecting the UK economy? Economic Observatory.
Related Blog Posts


Related Projects


Related News


Why it’s not worth worrying that the UK has technically entered a recession
26 Feb 2024
4 min read
Related Publications

Recessionary Pressures Receding in the Rearview Mirror as UK Economy Gains Momentum
12 Apr 2024
GDP Trackers
Related events

Summer 2023 Economic Forum

Spring 2023 Economic Forum

Winter 2023 Economic Forum

Autumn 2022 Economic Forum

Summer 2022 Economic Forum

Spring 2022 Economic Forum

Winter 2022 Economic Forum
