Tug of War Between New and Old Inflation Tougher Than Expected
Authors
Inflation was 8.7% in May, the same as the previous month. This indicates that inflationary pressure is as strong now as it was a year ago, with the new inflation dropping in being the same as the old inflation dropping out. This is the fourth month in which month-on-month inflation has been high, with an average over February to May of over 0.9% per month, which is equivalent to 12% annual inflation. This is now being driven partly by the response of wages to past inflation: in April the National Living Wage was raised by 9.7%, and this sets the reference for general wages in the lower ranges. This indicates that inflation is going to be far more persistent than was thought earlier this year.
The main contributors to inflation were:
Recreation and Culture 0.06 pp
Restaurants and Hotels 0.04 pp
Food and non-alc. Beverages -0.07 pp
Housing and household services -0.04 pp
The negative contribution of Food does not mean food prices were falling, simply that the increase in April-May 2023 was smaller than in April-May 2022. Food prices continue to increase. The two biggest positive contributors to inflation are in the service sector, Recreation and Culture and Restaurants and Hotels, both of which have a large part of their costs in terms of wages. They are also most affected by the increase in the National Living Wage.
The tug of war between new inflation dropping in and the old inflation dropping out has been much tougher than we had expected. The fall in inflation has been less than expected, as the new inflation has been much larger than expected. Looking forward, the inflation dropping out in June to September will be smaller, so that if the new inflation dropping in remains as high as it is, we may even see an increase in inflation over the summer. We have reintroduced the old “sanctions scenario” into our forecast but renamed it the “high persistence” scenario.
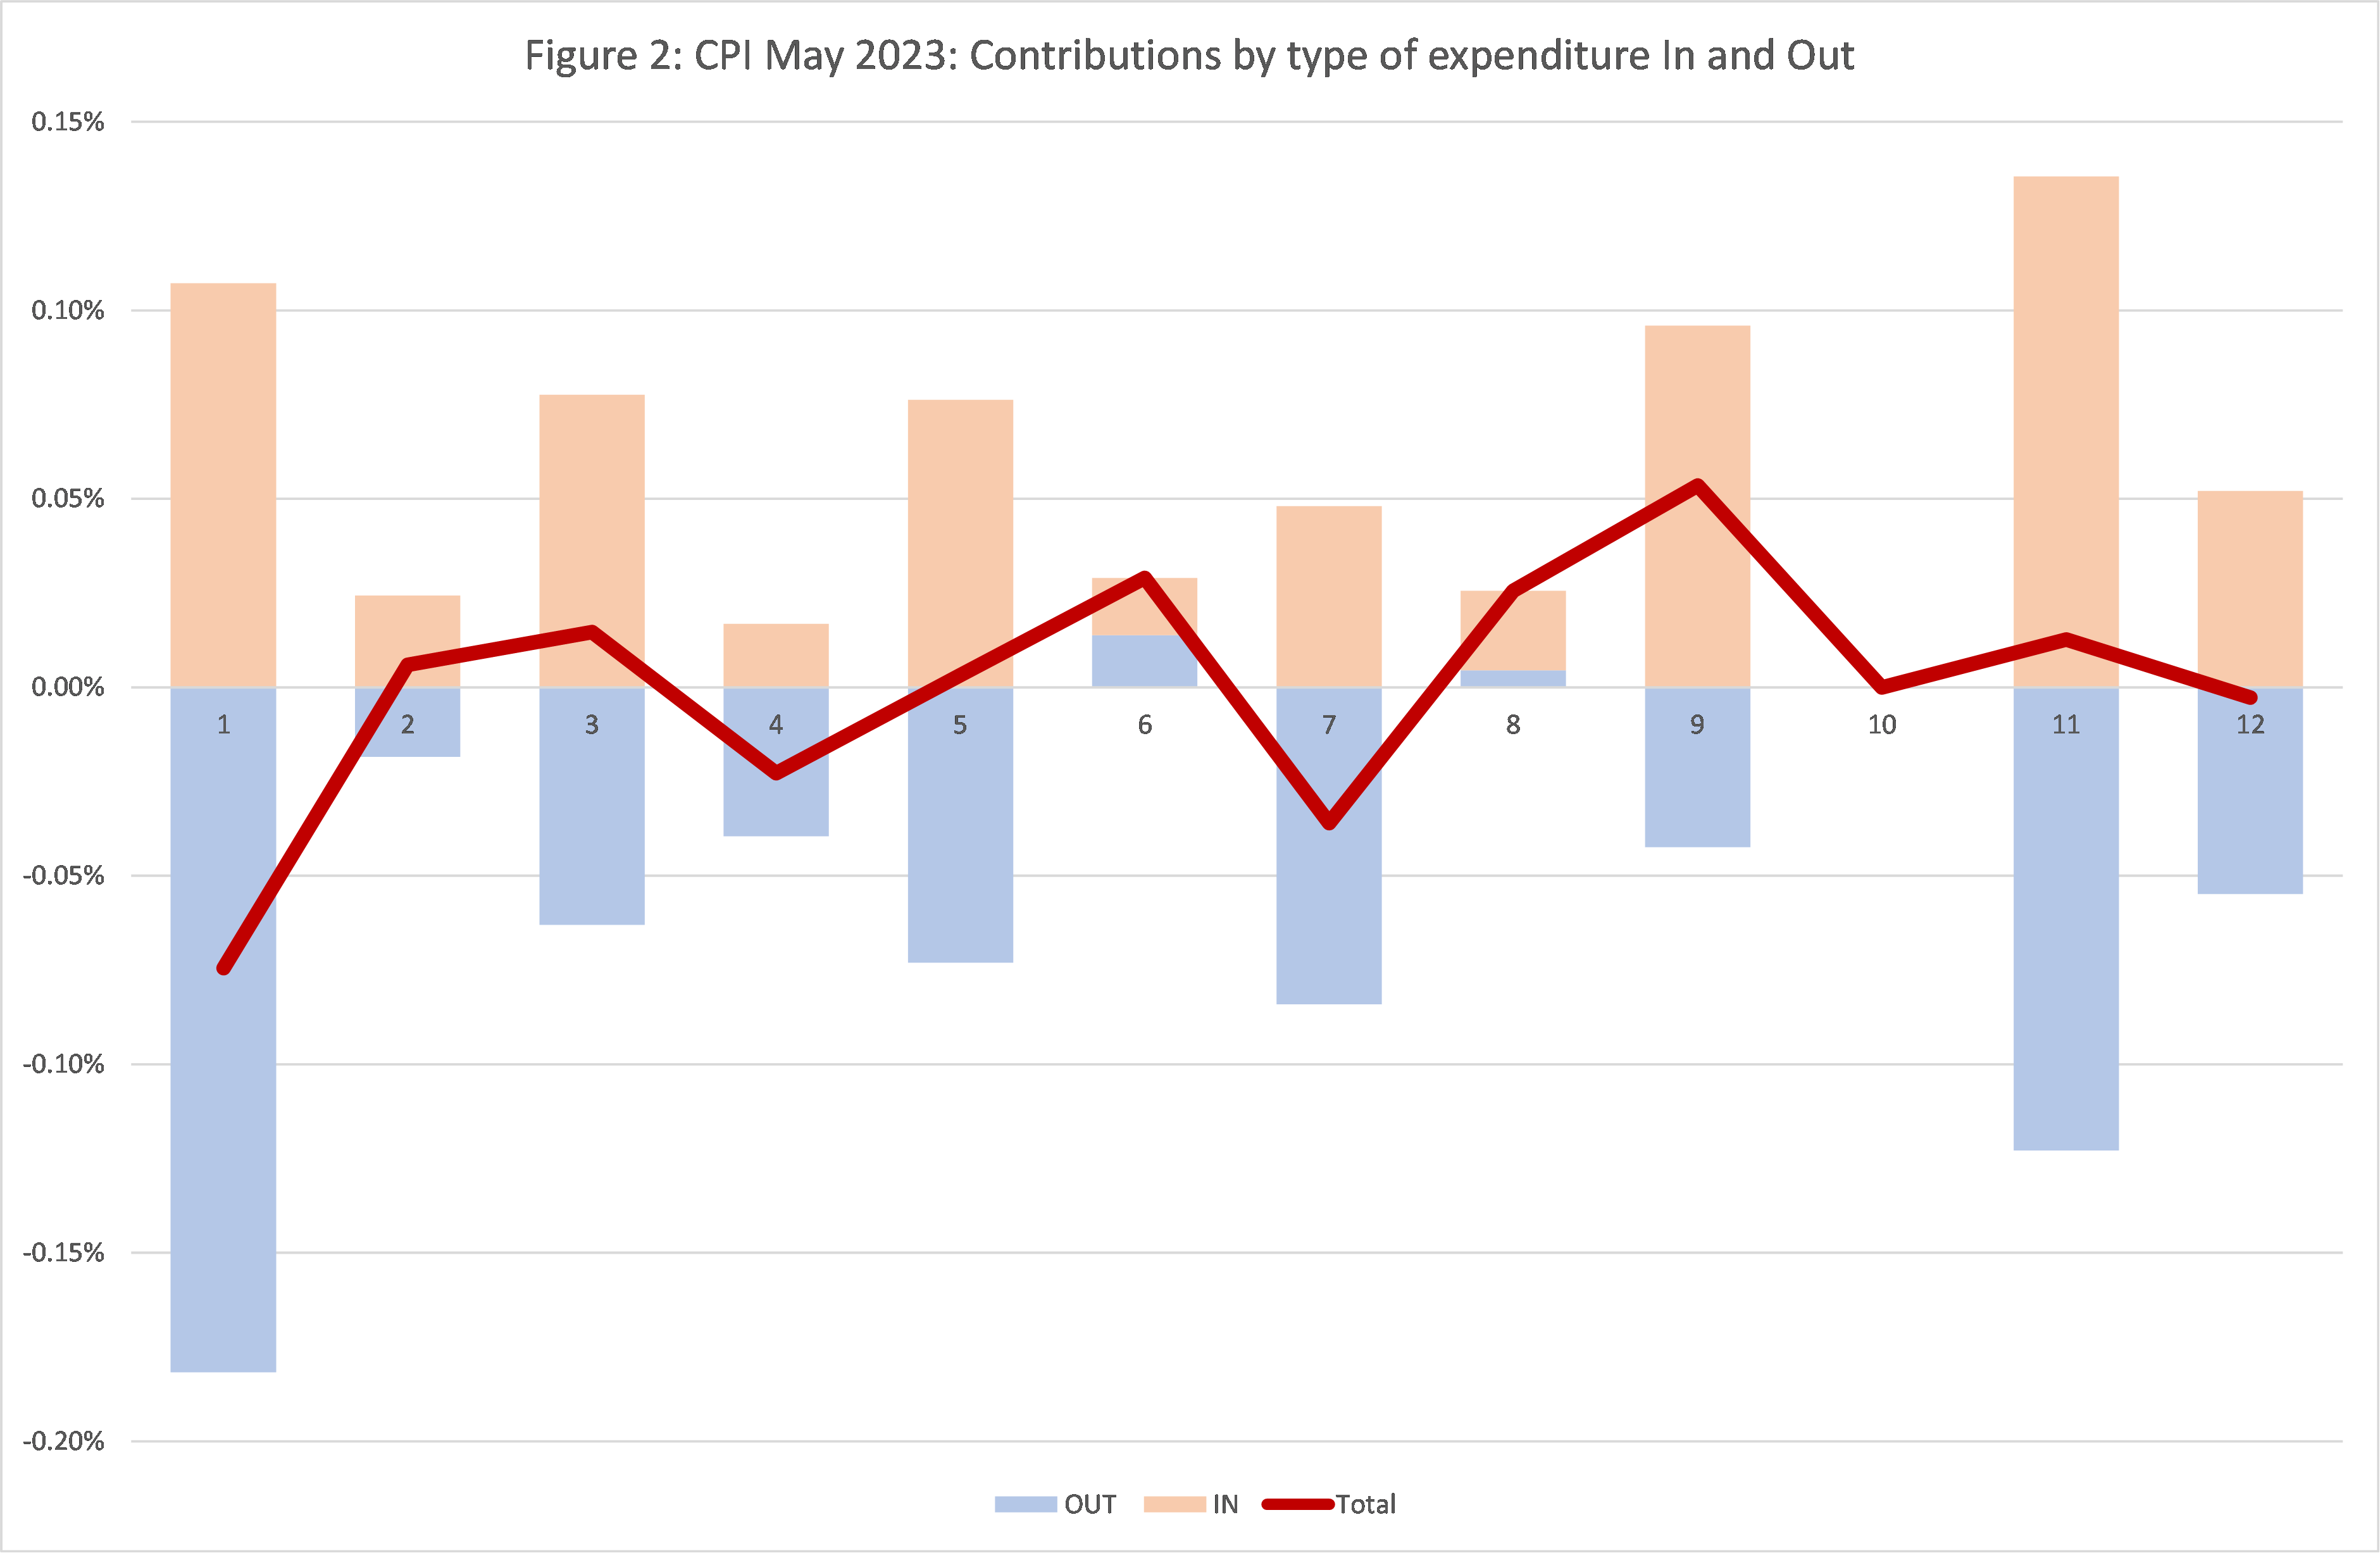
We can look in more detail at the contributions of the different sectors to overall inflation in Figure 2, with the old inflation dropping out of the annual figure (April-May 2022) shown in blue and the new monthly inflation dropping in (April-May 2023) shown in Brown, using the expenditure weights to calculate CPI. The overall effect is the sum of the two and is shown as the burgundy line.
We can see that for most types of expenditure, there are big dropouts from the previous year (the Blue team) and big drop-ins (the Brown team) in many sectors. Overall, the two balance out so that inflation remains constant. In fact, the Brown Team was slightly ahead, with inflation increasing from 8.66% in April to 8.68% in May to two decimal places.

Extreme Items
Out of over 700 types of goods and services sampled by the ONS, there is a great diversity in how their prices behave. Each month some go up, and some go down. Looking at the extremes, for this month, the top ten items with the highest monthly inflation are:
| Table 1: Top ten items for month-on-month inflation (%), May 2023 | |
| E-books | 42.45 |
| Internet Computer Games | 21.63 |
| Air Fares | 20.00 |
| Mobile Phone Applications | 17.59 |
| Premium Potato Crisps/Chips | 16.71 |
| Electric Razor | 15.69 |
| Blu Ray Disc (Film) From Chart | 15.20 |
| Vegetable Crisps Pack 80-125g | 13.78 |
| Electric Cooling Fan -Seasonal | 11.06 |
| Fresh Veg-Carrots-Per Kg | 10.86 |
March was not a good month for air travel or crisps. The ten items with the highest negative inflation this month are shown in Table 2.
| Table 2: Bottom ten items for mom inflation (%), May 2023 | |
| Tomato Ketchup Bottle 340-570g | -6.15 |
| Digital Media Player | -7.10 |
| Rotisserie Chicken [Whole] | -7.99 |
| Electric Toothbrush | -8.27 |
| CD Album (Top 40) | -8.52 |
| Kerosene – 1000l Delivered | -9.15 |
| Wallpaper Per Roll | -9.58 |
| Fruit/Veg Smoothie | -10.02 |
| Euro Tunnel Fares | -18.73 |
| Computer Game 2 | -20.09 |
Great month to get some new CDs and listen to them with your rotisserie chicken with lashings of tomato ketchup whilst drinking a smoothie.
In both these tables we look at how much the item price-index for this month has increased since the previous month, expressed as a percentage. These calculations were made by my former PhD student at Cardiff University, Dr Yang Li. Good luck to him on his return to China. Hopefully he can continue the updates from Shanghai.
Looking ahead…
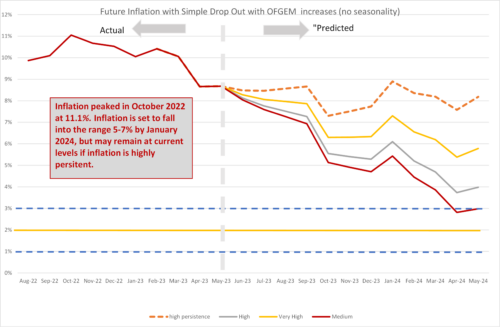
We can look ahead over the next 12 months to see how inflation might evolve as the recent inflation “drops out” as we move forward month by month. Each month, the new inflation enters the annual figure and the old inflation from the same month in the previous year “drops out”.[1] Previously we ended the “Sanctions scenario” introduced last March in response to the invasion of Ukraine by Russia. However, since the new month on month inflation remains high, we have re-introduced the Sanctions scenario, but renamed it the “high persistence” scenario since the causes have little to do with war and sanctions but rather domestic wage-price dynamics. We depict the following scenarios for future inflation dropping in:
- The “medium” scenario assumes that the new inflation each month is equivalent to what would give us 2% per annum – 0.17% per calendar month (pcm) – which is both the Bank of England’s target and the long-run average for the last 25 years. This is a reference point only, as inflation will be well above this level for the next year.
- The “high” scenario assumes that the new inflation each month is equivalent to 3% per annum (0.25% pcm).
- The “very high” scenario assumes that the new inflation each month is equivalent to 5% per annum (0.4% pcm). This reflects the inflationary experience of the UK in 1988-1992 (when mean monthly inflation was 0.45%). It also reflects the continuation of the UK average in the second half of 2021. This level of month-on-month inflation would indicate a significant break from the historic behaviour of inflation from 1993-2020.
- The “high persistence” scenario assumes new month on month inflation of 0.6%, which is equivalent to an annual rate of 7.4%.
In recent months our central forecast was the “very high scenario”. However, as inflationary pressures are persisting, we believe that inflation will be in the range between this and the “high persistence” scenario.
We have dropped the “low” scenario from previous releases as this is still likely to be irrelevant for 2023. In all scenarios, there is a rapid fall in inflation from February 2024, which is due to the drop out of the high inflation figures in the corresponding months this year. However, inflation will remain well above 2% for the whole of 2023.
This forecast assumes that geopolitical tensions do not deteriorate. Direct conflict between Russia and NATO would rapidly worsen the picture for inflation. Looking east, if the rising tensions between the US and China lead to an intensification of the trade war or even open military conflict in the South China sea or Republic of China (Taiwan), world supply chains would be disrupted, and inflation significantly raised, possibly to levels far higher than seen in 2022. However, on the other side the KMT party may return to power in Taiwan in 2024 and there may be a negotiated settlement between Russia and Ukraine, particularly if there is a decisive outcome on the battlefield.
Figure 2: Looking forward to May 2024.
For further analysis of current and future prospects for inflation in the UK see:
How does Inflation affect the economy when interest rates are near zero? Economics Observatory.
How are rising energy prices affecting the UK economy? Economic Observatory.
[1] This analysis makes the approximation that the annual inflation rate equals the sum of the twelve month-on-month inflation rates. This approximation ignores “compounding” and is only valid when the inflation rates are low. In future releases I will add on the compounding effect to be more precise at the current high levels of inflation.
Related Blog Posts


Related Projects


Related News


Why it’s not worth worrying that the UK has technically entered a recession
26 Feb 2024
4 min read
Related Publications

Recessionary Pressures Receding in the Rearview Mirror as UK Economy Gains Momentum
12 Apr 2024
GDP Trackers
Related events

Summer 2023 Economic Forum

Spring 2023 Economic Forum

Winter 2023 Economic Forum

Autumn 2022 Economic Forum

Summer 2022 Economic Forum

Spring 2022 Economic Forum

Winter 2022 Economic Forum
